
Crime data was collected from Houston Police Department's site and the features selected for analysis were demographics collected from census.gov and weather data collected from openweathermap.org. In order to join this data together, additional geographical information was collected through API's from nominatim.org (using python's GeoPy library) and from geocoding.geo.census.gov. Finally, after cleaning, the data was stored on a PostgreSQL database in the cloud, using Amazon Web Services.
 |
|---|
| Fig. 1: Data Sources and Joins |
All crime data on HPD's website was in initially in .xls format so all the files had to be downloaded and converted to csv format. Manually the 2018 had to have certain columns and image headers removed to prevent issues when trying to read the data in Python. From there we used Pandas to go through the CSVs, changing the column names to match for each of the years, and compile the dataset into one dataframe.
The final Flask app has been deployed on AWS Elastic Beanstalk, and has the following functionalities:
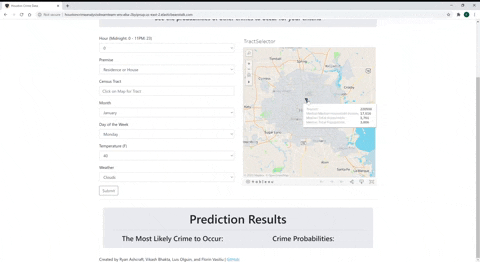
- Home page (fig. 2) with input fields for the machine learning model, including tract autocomplete field, and summary of prediction results.
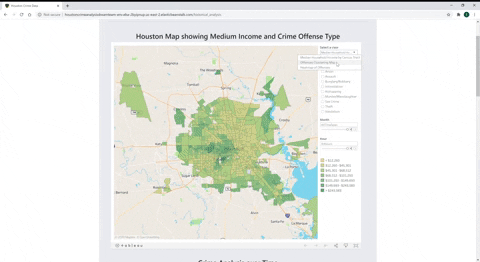
- Historical analysis page (fig. 3) with Tableau sheets and dashboards.
- Machine Learning page, which documents the machine learning algorithm used to make predictions.
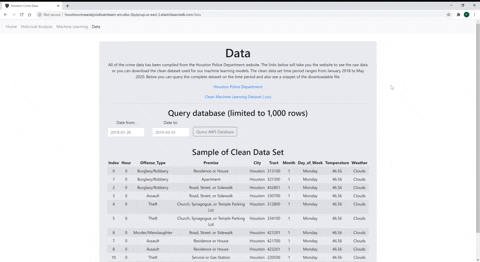
- Data page (fig. 4), which links to the datasource of the analysis (AWS S3 for csv file and AWS RDS for PostgreSQL query)
 |
 |
|---|---|
| Fig. 2: Selecting Tract and Making Predictions | Fig. 3: Exploring Tableau Dashboards |
 |
|---|
| Fig. 4: Downloading from AWS S3 Bucket and Querying AWS RDS Database |