-
Notifications
You must be signed in to change notification settings - Fork 46
Plotting time series of events
Glenn Thompson edited this page Oct 14, 2015
·
6 revisions
Let's use the Tohoku dataset we saved previously.
>> load tohoku_events_1day.mat
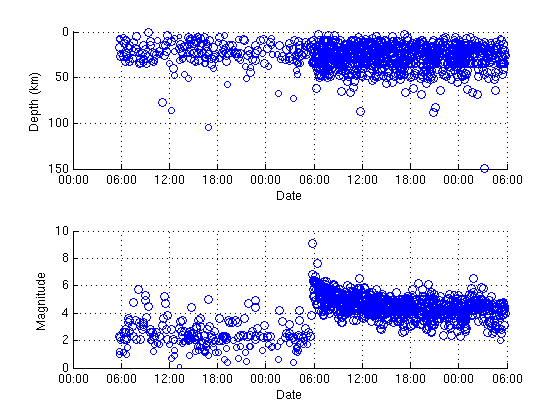
>> catalogObject.plot_time()

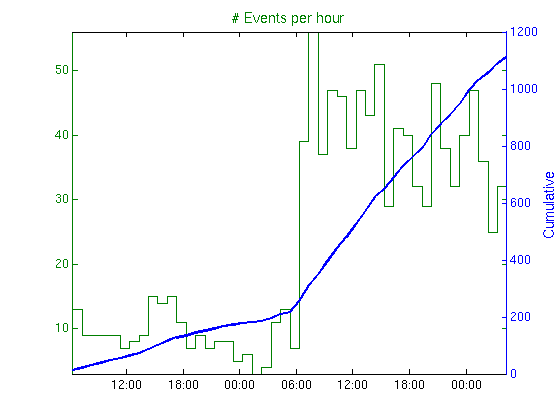
A plot of seismic catalog per day is often called an "event counts" plot. In GISMO, we call this an "event rate plot" and the first step is to generate an EventRate object.
For a quick plot of earthquakes per hour, we create an EventRate object and then plot it. Here our binsize is 1/24 days, i.e. 1 hour.
>> eventrateObject = catalogObject.eventrate('binsize', 1/24);
>> eventrateObject.plot()

To see more of the things we can do with EventRate objects see SCAFFOLD: this Tutorial.
Code | Wiki | Tutorials | Website | Mailing list | Getting started | Reporting problems
- What is GISMO?
- Who uses it?
- Historical Development
- Getting started
- Getting and using the develop branch
- GISMO data types
- * Tutorials *
- * Workflow examples *
- * Applications *
- The GISMO Users Group
- Reporting errors, bugs, issues
- Contributing to GISMO
- * SUGGESTED CITATION *
- News
- Future Development
- Links