Debugging ide fortran
If you encountered uncaught exceptions that cannot be traced to errors reported by running the language server in debug mode the follow steps may help you diagnose the issue for bug reporting.
A log of all messages sent to and received from the fortran language server can be generated by setting the property core.debugLSP = True in Atom's configuration. This can be done by editing the config.cson file, opened by "Atom->Config..." on MacOS. The location and format of the required property setting is shown below, where ... indicates additional properties will likely be present in the file. Atom must be restarted after editing this file for changes to take effect.
"*":
  ...
  core:
    debugLSP: True
Note: This setting can generate a large amount of debug information in the developer console. It is best to enable this setting only when explicitly debugging language server to package interaction.
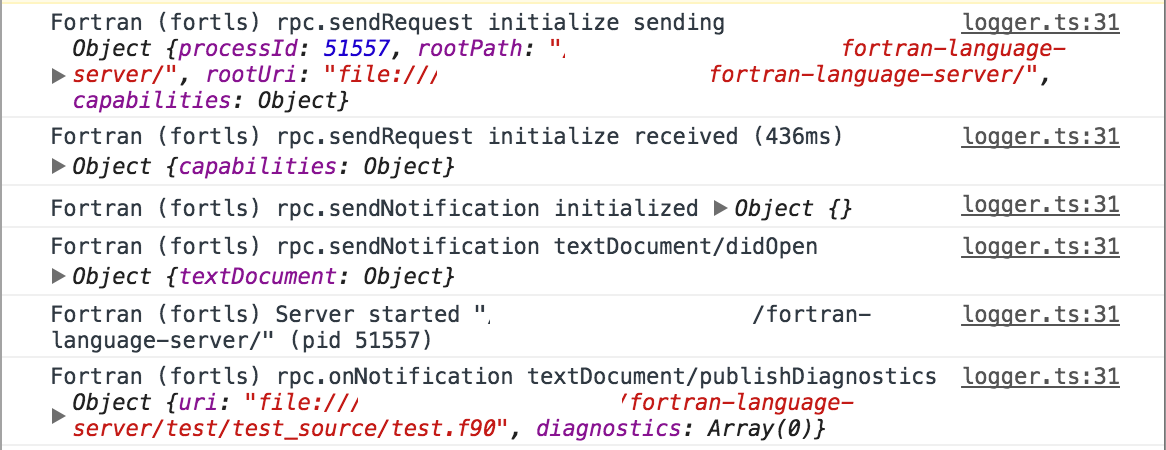
With core.debugLSP = True every message passed between Atom and the fortran language server will be logged to the developer console. The console may be viewed by first opening developer tools "View->Developer->Toggle Developer Tools", then clicking on the "Console" tab. You should see a list of request and responses that start with Fortran (fortls) ..., along with the JSON content for each request and response that may be expanded to view by clicking on the arrow in each log cell. An example log snippet is shown below.