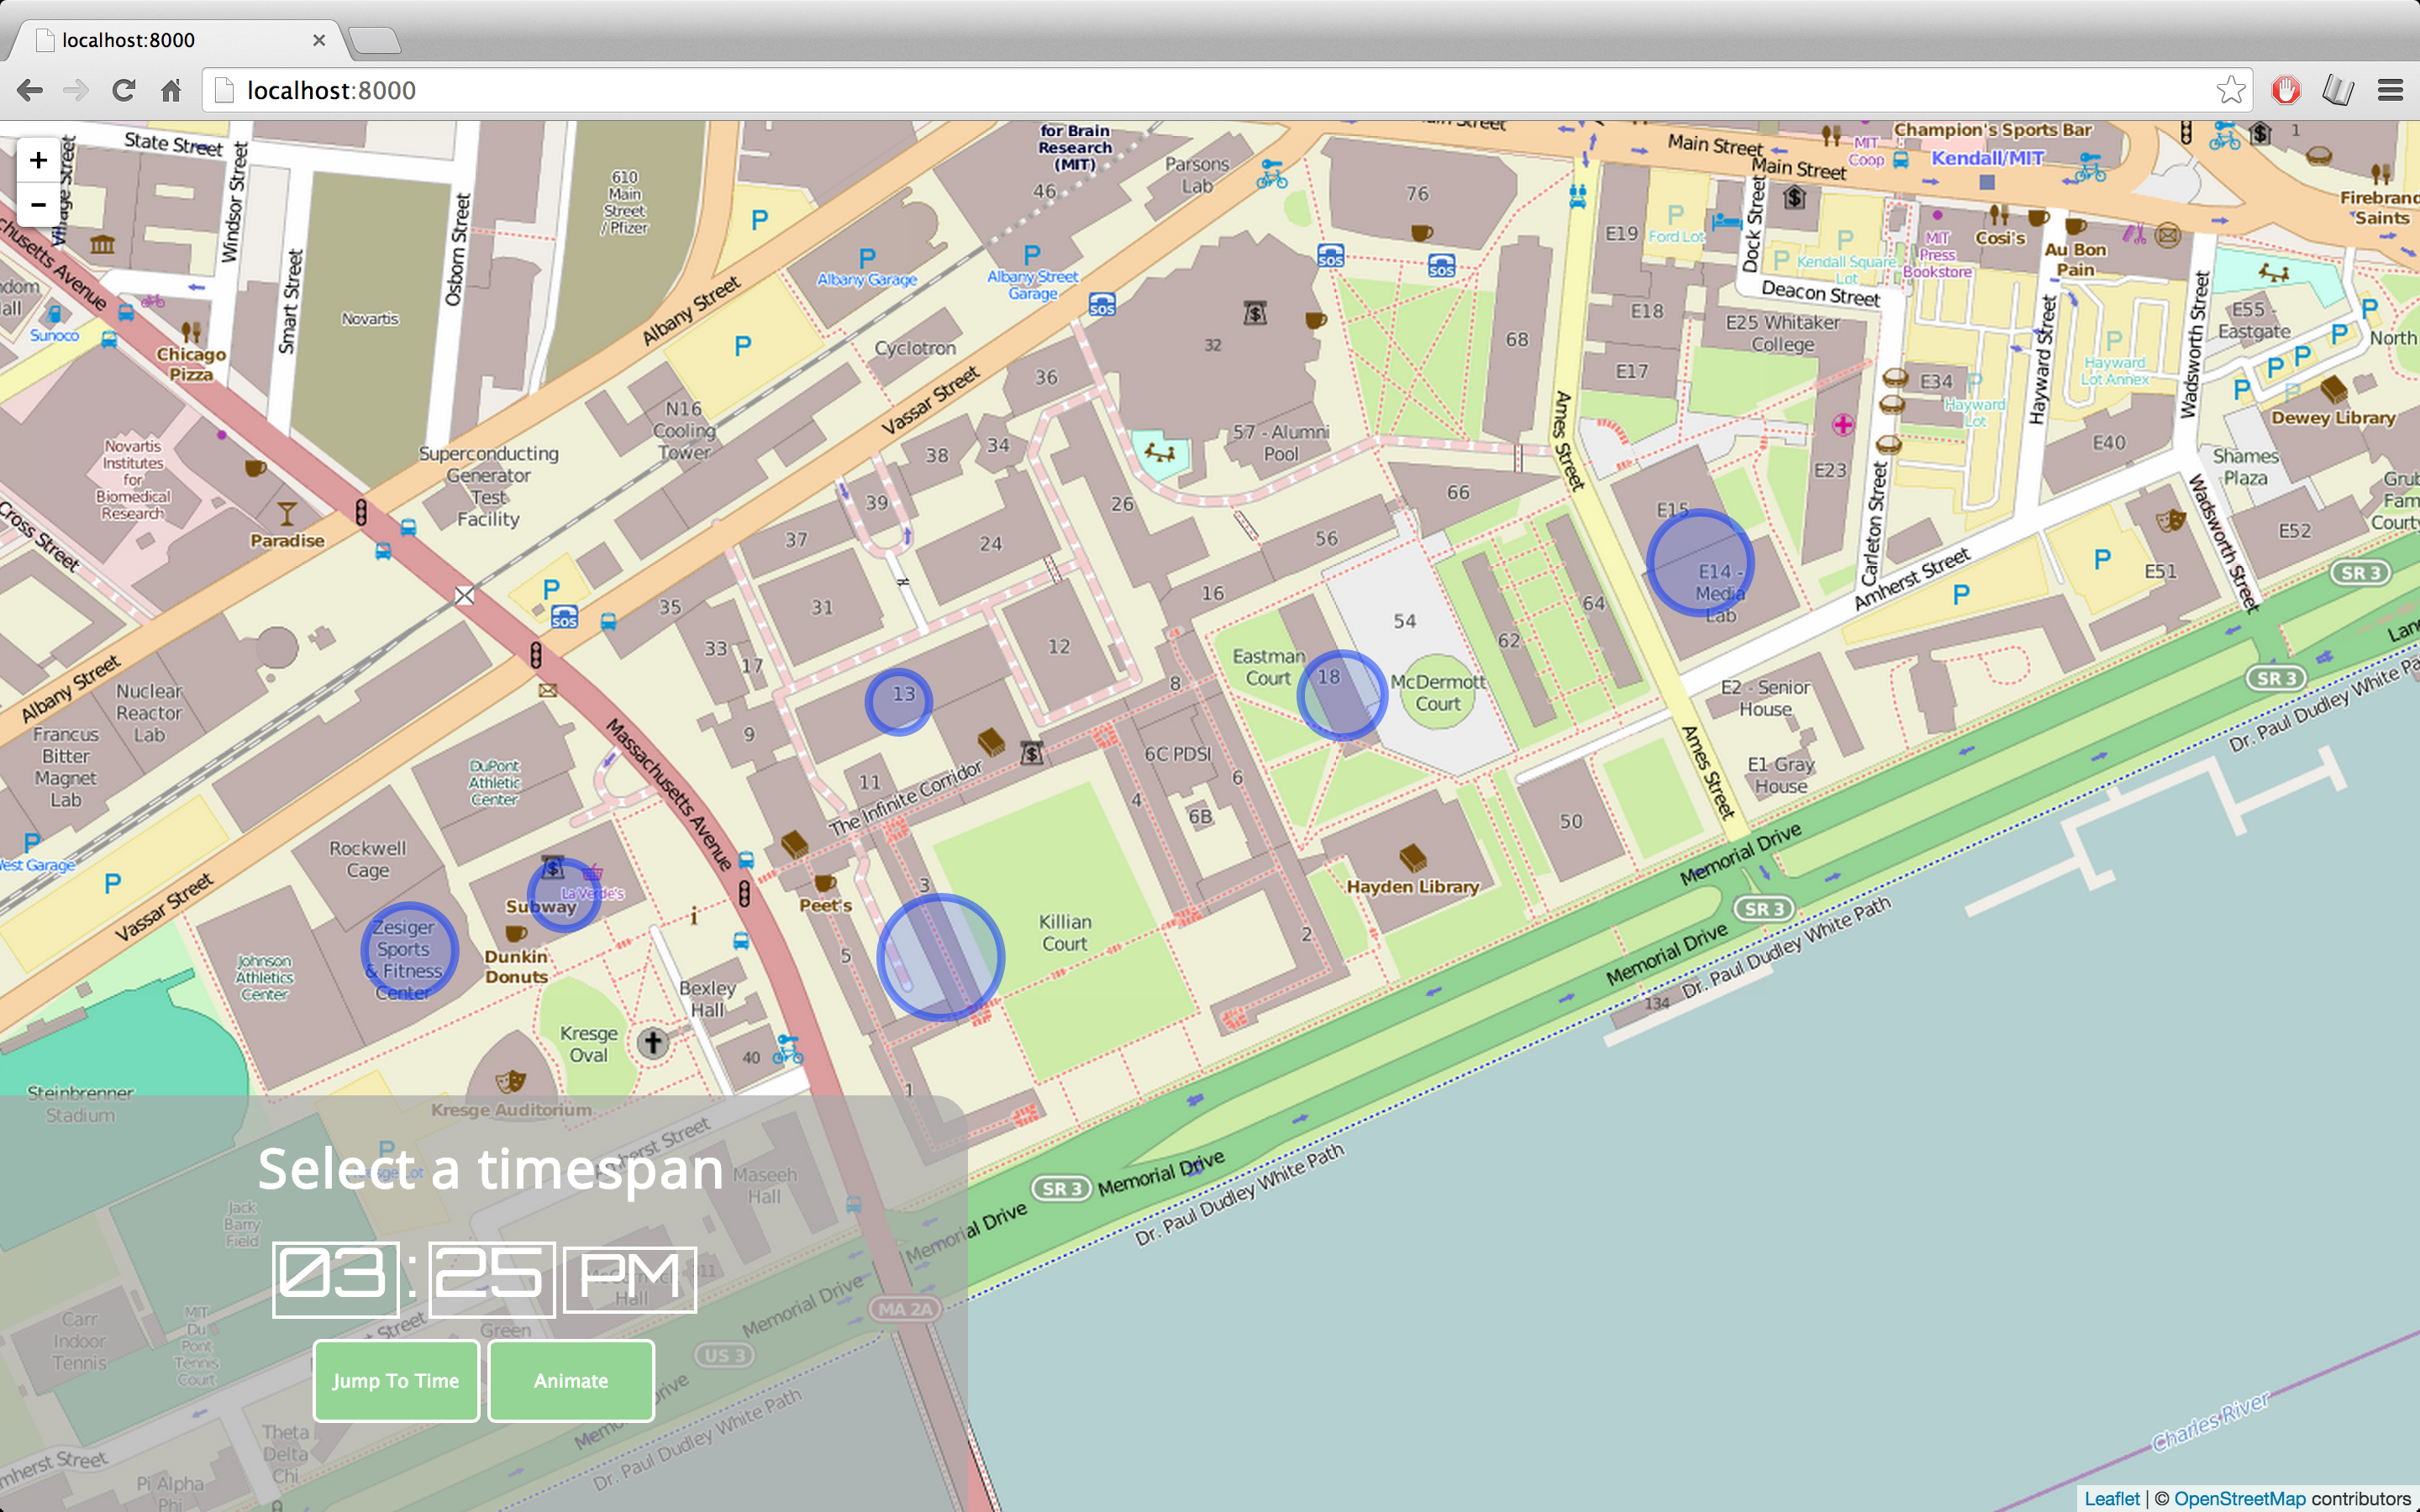
This visualization demonstrates Wi-Fi usage at MIT throughout the given day. Each blue circle in the visualization represents a Wi-Fi access point on campus. The area of the circle is proportional to the number of users connected to the access point at a given time.
The data being used is at util/data.csv. It consists of (timestamp, num_connected, id, longitude, latitude) tuples.
Go to wifi.firebaseapp.com.
- Install dependencies with
bower install. To do this, you need to have bower. - Launch an HTTP Server to serve static files in this directory:
python -m SimpleHTTPServer(if you are on Python 3, usepython -m http.server). - Navigate your browser to
http://localhost:8000/