-
Notifications
You must be signed in to change notification settings - Fork 19
Part 4. Your Personal Dashboard

Go to your Initial State account and click on the new data bucket with the name corresponding to the BUCKET_NAME parameter (i.e. Beer Fridge). Click on Tiles to view your beer/wine fridge dashboard. You should see four tiles once you have opened up your refrigerator and removed bottles from it - Temperature(F), Bottles Present, Bottle Removed, and Door. Open and close the door, remove bottles, and watch the dashboard update in real-time. This dashboard gives you the ability to see what is happening with your refrigerator at-a-glance, very handy when you are at the store or out-of-town.
If you want to know how many bottles have been removed since you made your beer/wine fridge awesome, you can see that in the Bottle Removed tile. In my dashboard above, I drank 4 bottles of beer by the time I took that screenshot. I can see that I have 39 bottles left in my refrigerator, and the door is currently closed. It is interesting to see how much my temperature changes. The temperature fluctuates between 36 and 43 degrees regularly. The LED on my refrigerator tells me that the temperature is constant at 39 degrees. In other words, my refrigerator lies!

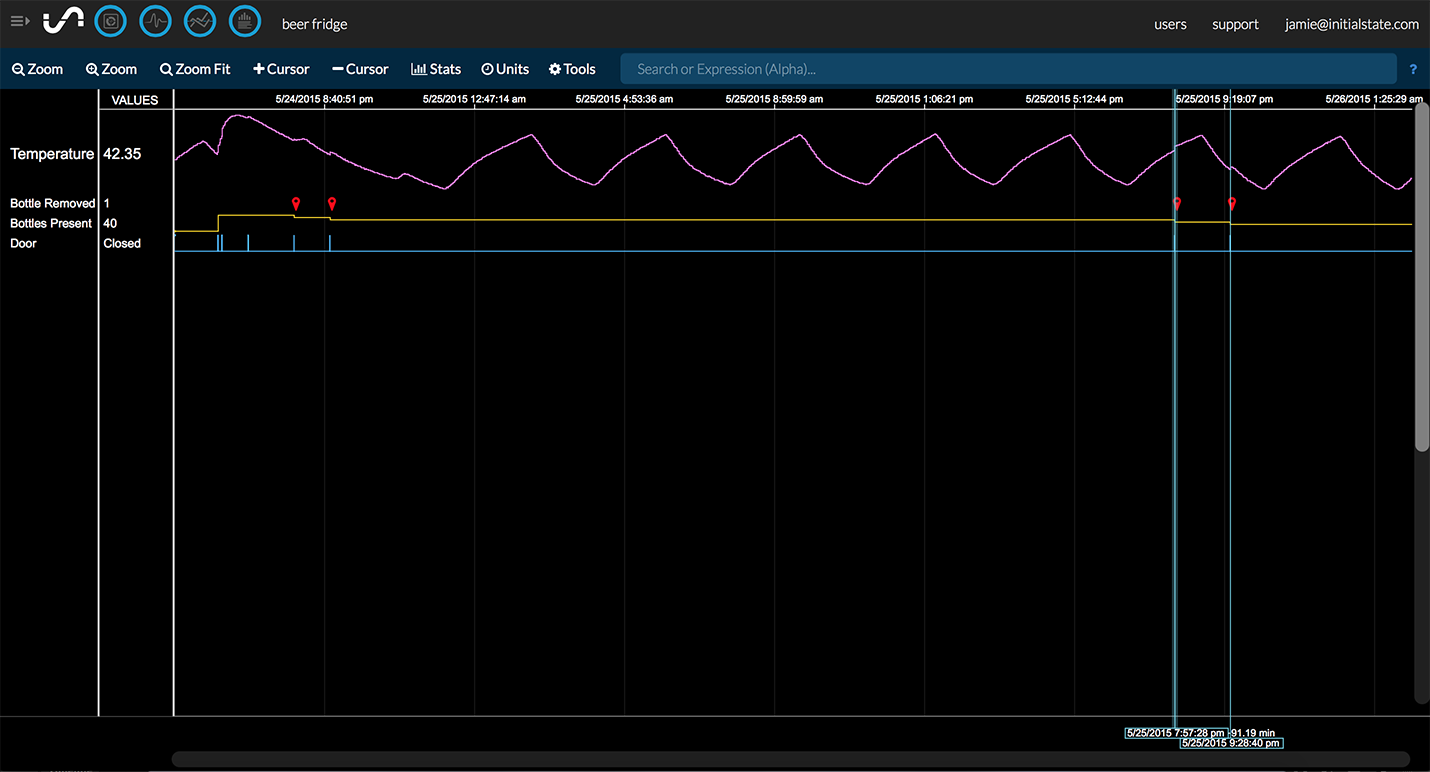
Switch to the Waves visualization to better see the history of your refrigerator data. With Waves you can take measurements and dig through your data to see when things happened. I can see that I drank two beers, 91 minutes apart on May 25 at 7:57 pm and 9:28 pm.

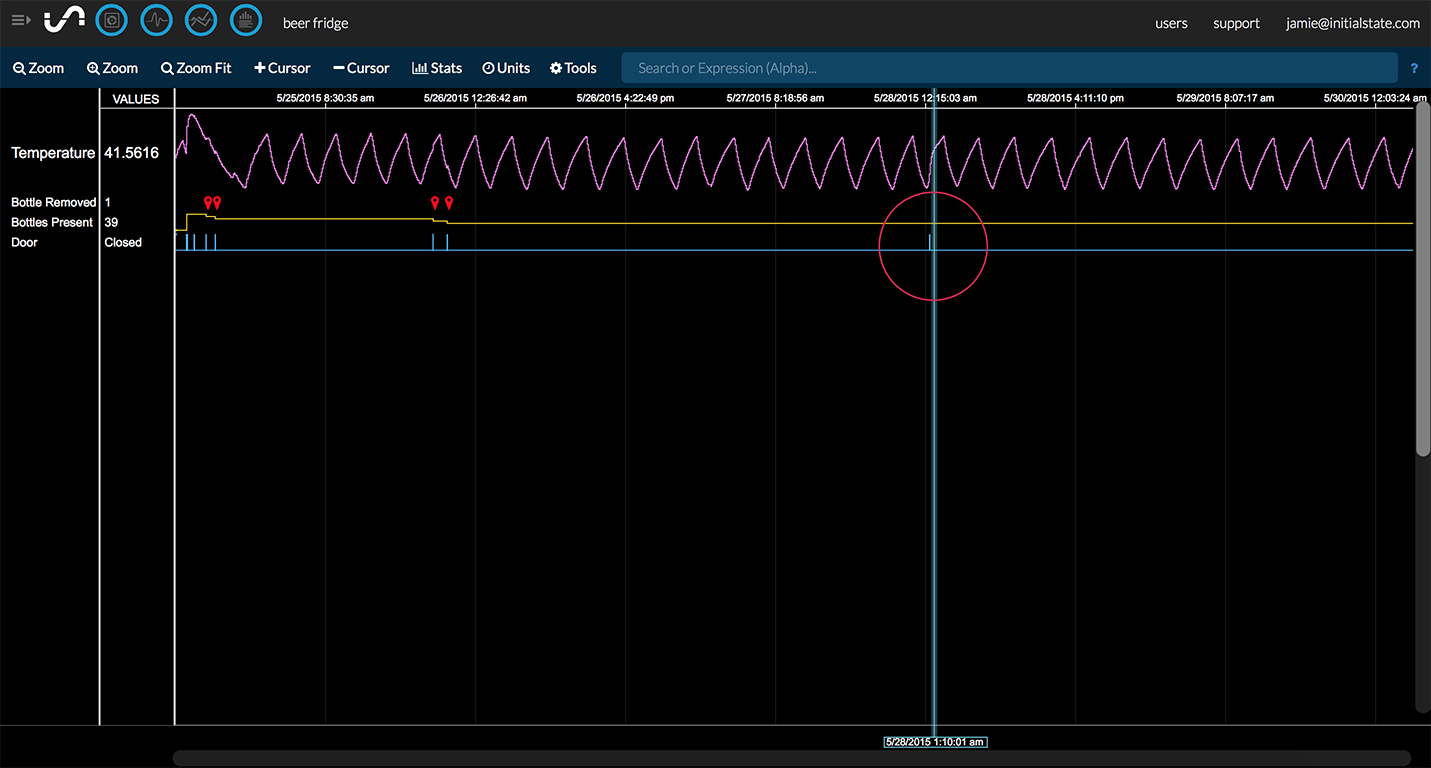
I can see that while I was out-of-town on May 28, my under 21 years of age nephew (who was house-sitting) opened up my beer fridge at 1 am only to realize that those new electronic gizmos sitting near the refrigerator might just be snooping on his beer thievery habits. He thought better of taking a beer and simply closed the door. Ha!
That's it. If you have any questions or have any comments about this tutorial, please email me.
<< Part 4: The Final Script - Part 5: BONUS Configure Your Own Beer Alerts >>