7. Report Viewer
The JPlag Report Viewer is a web application that can be used to display the result zip file generated by JPlag.
The report viewer can be started via the JPlag JAR file by specifying the mode. This is done over the --mode/-M flag (available since version 6.0.0):
| Value | Effect |
|---|---|
| run_and_view | Runs JPlag on the given files with the given options. After running, it opens the report viewer. The report viewer will then automatically load the result. |
| view | Opens the report viewer. When providing a result zip file from a previous JPlag run - either in a way a source directory would be given or through the -r flag. If no file is given, the landing page will be opened. |
| run | Runs JPlag without opening the report viewer. |
When no value is given for the mode flag, JPlag tries to guess the best mode. When calling it with submission files, it executes the run_and_view mode. When the positional argument is a zip file including a report, it starts the view mode and opens the given report. When no arguments are given, the report viewer is started in view mode without any given file, leading to the landing page.
On the landing page, a report can be opened by either dragging the zip file onto the page. Alternatively, when clicking the red square, a file chooser dialog will open.
Reports can fetched from a server by appending ?file=URL.
Example: jplag.github.io/JPlag?file=domain.tld/my-report.zip
With increasing versions, the report may change, and the report viewer may not be able to read a report from an earlier version. When trying to open such a report, the report viewer will redirect you to an older version of the report viewer. This older report viewer may not support all the newest features of JPlag. This feature is only when starting the report viewer through the jar.
The application requires Node.js and npm to be installed on the system.
npm install
npm run dev
There are different ways to build the report-viewer.
The report viewer will be built and packaged with the cli in a jar file if built with the with-report-viewer profile:
mvn -Pwith-report-viewer clean package assembly:single
To build it in the standard way, without any base url, run:
npm run build
For production builds (for example, to host on GitHub Pages in a repository called JPlag) run:
npm run build-prod
When hosting this build, it will need to be accessible under yourdomain.tld/JPlag/.
To build the demo version run:
npm run build-demo
Similar to the production build, this build will have demo as its base url.
 This view is used to load files into the report viewer. More information can be found above.
 The Overview shows general information about the entire dataset and is not specific to a single comparison.
The top shows some general information about the report. More information can be accessed over the more button.
The distribution diagram splits the submissions into buckets according to a certain similarity metric. This includes all calculated comparisons, not just the ones included in the report. The used metric can be changed in the options under the diagram. In addition, the amount of buckets can be changed. The scale can be switched between a linear and a logarithmic representation.
The comparison table displays the included comparisons. These may not be all comparisons performed by JPlag, depending on the number of submissions and the configured options. The table can be sorted by each metric or grouped by cluster. The search bar has multiple features:
- It filters the rows of the table by the names of the submissions. To filter for multiple names, separate them by a space. The parts come together in a disjunctive way.
- It filters the table by index, either by just typing a number (e.g.
81) or prefacing it with theindexkeyword (e.g.index:81) - It filters by metric when the number is prefaced with a comparator (</>/<=/>=) (e.g. >90). To filter by a specific metric, preface the comparator with its short metric name (e.g. avg:>90)
- When fully typing out a name, it gets unhidden
Each row shows the index, the names of the two submissions in the comparison and its similarities in the different metrics. Comparisons that are part of a cluster will have that information displayed at the end of a row. All comparisons in a cluster have their icon colored the same. The number behind the icon shows how many submissions are included in the cluster. Clicking this icon will open the cluster in its own view. When hovering over a name, an eye will show up. Clicking this eye toggles the anonymization of this submission. Clicking the other parts of the opens the comparison.
 At the top of the comparison view, different similarities for the submission can be seen. The average similarity is the same as that shown in the comparison table. The similarities labeled with the submission names show the percentage of tokens for the named submission that appear in the other one.
Below that, the bubbles represent a single match. They show the file names in both submissions and the number of tokens in the match. Clicking on this bubble will scroll to both matches in the code.
The files can also be sorted by the following options: | Alphabetic | Sorts the files by their name. | | Match Coverage | Sorts the files by how many of its tokens are part of a match in descending order. | | Match Count | Sorts the files by the number of matches in them in descending order. | | Match size | Sorts the files by their largest match in descending order. |
Each code container has a list of files. The file order can be changed either through the options described above or by dragging them around. The percentage at the end of each file header shows how many tokens of the file are part of a match. Clicking on this header expands and collapses the file content.
The matches are visualized via colored blocks. Clicking on one scrolls to the match in the other submissions code.
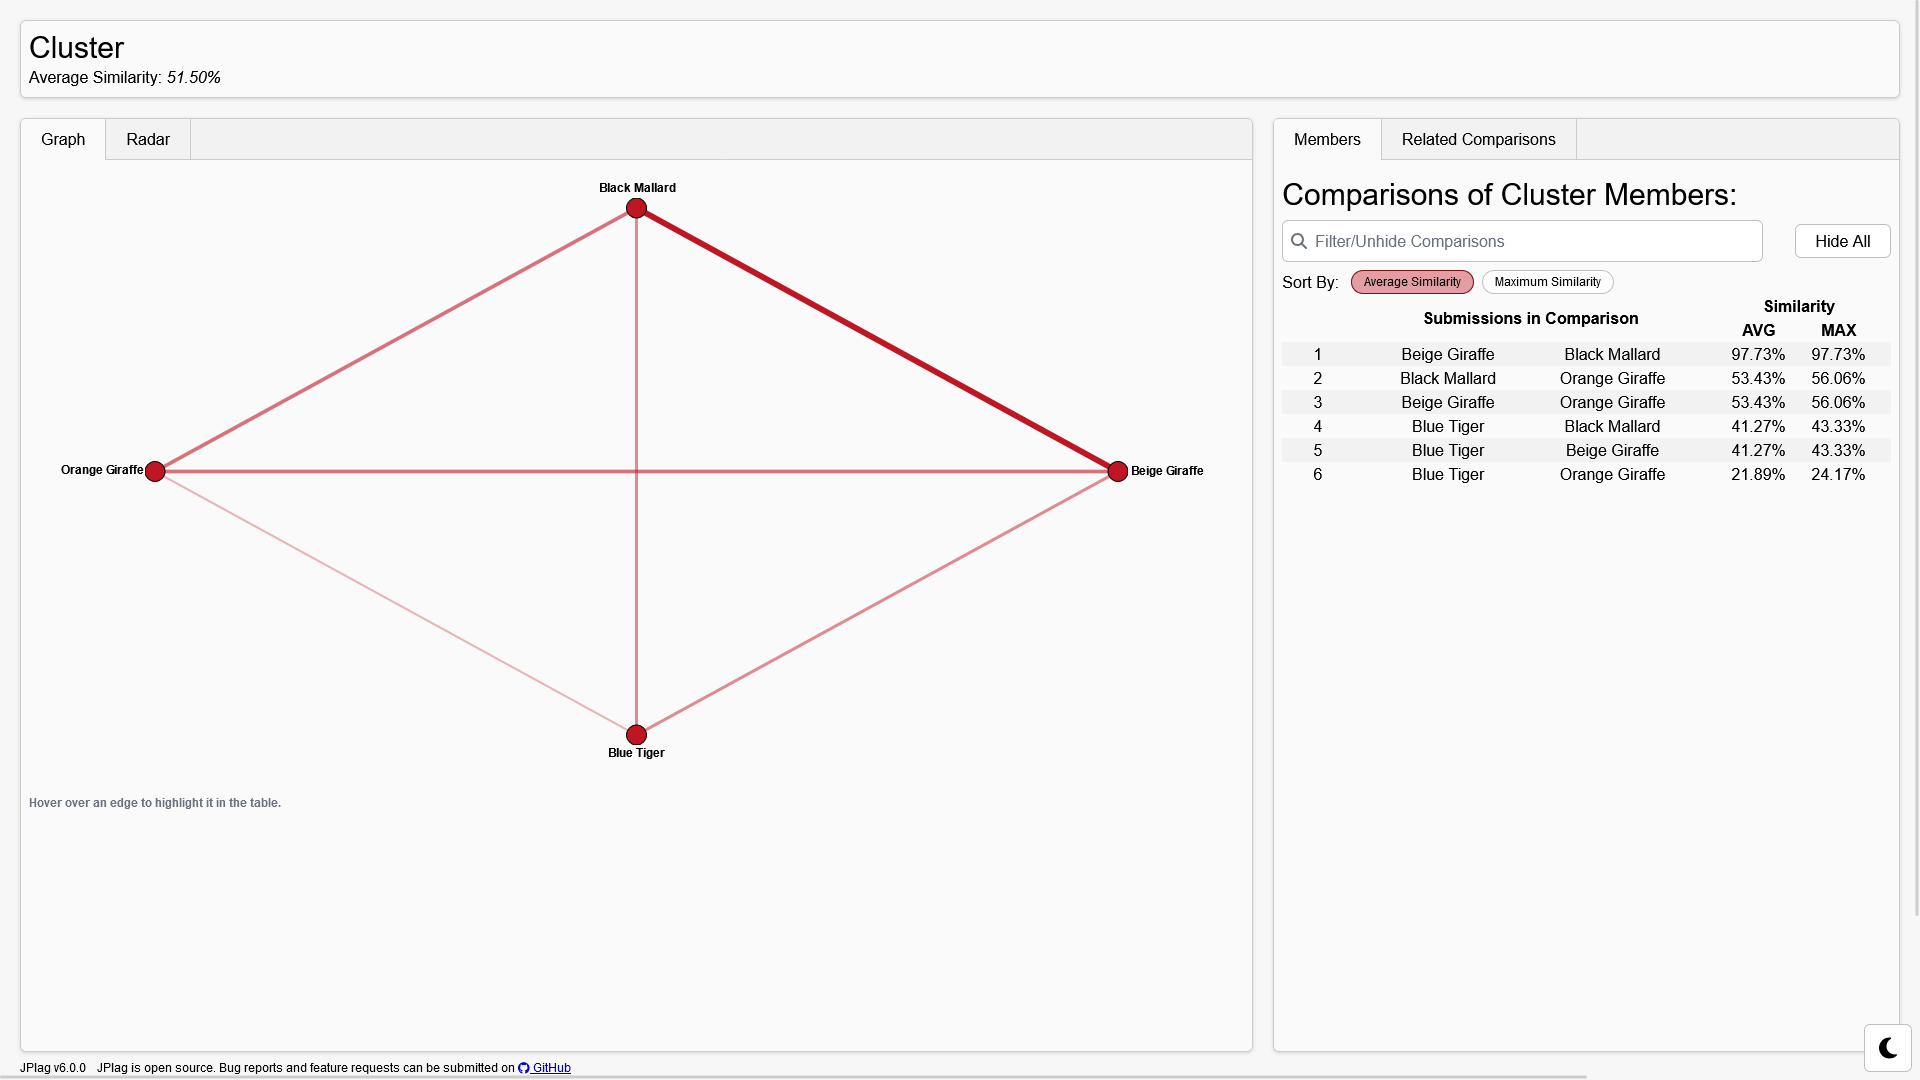
At the top of the page, some general information about the cluster, such as its similarity, is given.
On the left, there are two ways to display a cluster In the graph, each node represents a submission. The thickness and opacity of the edge is an indicator for the similarity of the comparison between the two submissions. When a comparison is not part of the report, its edge will be gray and dotted. Hovering over an edge will highlight it in the table on the right.
 The other option to display a cluster is a radar chart. It may not be available in some reports when there are not enough comparisons of this cluster present.
It shows the similarity of the other submissions in a cluster relative to one submission. This submission can be changed in the dropdown at the top. Not all submissions may be available here due to them not having enough comparisons in the report.
The other option to display a cluster is a radar chart. It may not be available in some reports when there are not enough comparisons of this cluster present.
It shows the similarity of the other submissions in a cluster relative to one submission. This submission can be changed in the dropdown at the top. Not all submissions may be available here due to them not having enough comparisons in the report.
The table on the right has two modes that can be changed at the top. The mode called "Members" shows a similar comparison table to the overview only containing the comparisons of this cluster. The mode called "Related Comparisons" also holds a similar table. Each comparison in this table has one submission from the cluster while the other is not part of the cluster. This can be used to identify false negatives of the clustering.
 The information view displays data about the run, like date, execution time and number of submission.
It also displays all the options used by JPlag.
When anonymizing a submission, its name gets replaced by the word anon followed by a number. This number gets chosen when first anonymizing a submission and stays unique for this submission until closing the report. If the submission name is present in the code or the filename, it does not get replaced there.
There are two ways to anonymize a submission. When hovering over a submission in a table, an eye will become visible. Clicking it will change its anonymization status.

The other option is to clock the "Hide All" button at the top of the comparison table. When all submissions are anonymized, it will change to a "Show All" button that will de-anonymize all submissions.
We're happy to incorporate all improvements to JPlag into this codebase. Feel free to fork the project and send pull requests. Please consider our guidelines for contributions.
Before committing, please run the following commands to ensure that the code is properly formatted and linted.
npm run format
npm run lint
This can also be done automatically by the pre-commit hooks. They get automatically installed when running npm install.