
TabDPT is an open-source foundation model for tabular data based on in-context learning (ICL). It is trained on real-world data and can generalize to new tasks without additional training or hyperparameter tuning.
This repository provides lightweight interface code to generate predictions on new tabular datasets. Full training code is available here.
TabDPT is available on Hugging Face.
To set up this repo, first ensure you have Python 3.10 or 3.11. Then, run the following:
git clone [email protected]:layer6ai-labs/TabDPT.git
cd TabDPT
pip install -e .
pip install --group dev
Alternatively, if you are using a package manager such as uv, you can run
uv sync
You may also need a C++ compiler such as g++ for building dependencies. On Ubuntu, you can install it with:
sudo apt-get update
sudo apt-get install g++
Lastly, you will need a python-dev system package. On Ubuntu, it can be installed with:
sudo apt-get update
sudo apt-get install python-dev
If you experience errors caused by torch compile (e.g., InductorError), try updating package versions and system drivers.
For better runtime performance, adjust context_size or n_ensembles to trade off speed and accuracy.
See tests/cls_example.py and tests/reg_example.py for examples of how to use TabDPT once installed.
TabDPT uses retrieval and self-supervised learning to remove constraints on dataset size and to enable effective generalization from pre-training on real data. We find this to be competitive with existing ICL training approaches, and outperform leading deep learning and tree-based models:
| Algorithm | CC18 | CTR23 | ||
|---|---|---|---|---|
| AUC | Accuracy | Correlation | R2 | |
| TabDPT v1.1 (Ours) | 0.976 [0.974, 0.978] | 0.928 [0.926, 0.931] | 0.920 [0.918, 0.922] | 0.847 [0.843, 0.851] |
| TabDPT v1.0 (Ours) | 0.972 [0.971, 0.973] | 0.917 [0.915, 0.919] | 0.911 [0.908, 0.913] | 0.831 [0.826, 0.835] |
| TabPFN v2 | 0.972 [0.970, 0.974] | 0.917 [0.915, 0.919] | 0.917 [0.911, 0.921] | 0.841 [0.831, 0.848] |
| TabPFN | 0.939 [0.935, 0.943] | 0.852 [0.849, 0.856] | N/A | N/A |
| TabR | 0.967 [0.965, 0.969] | 0.923 [0.920, 0.926] | 0.909 [0.905, 0.912] | 0.825 [0.817, 0.831] |
| MLP-PLR | 0.967 [0.965, 0.968] | 0.914 [0.911, 0.917] | 0.907 [0.904, 0.910] | 0.827 [0.822, 0.832] |
| MLP | 0.915 [0.909, 0.920] | 0.865 [0.860, 0.870] | N/A | N/A |
| XGBoost | 0.965 [0.963, 0.967] | 0.910 [0.906, 0.913] | 0.904 [0.900, 0.907] | 0.820 [0.814, 0.825] |
| LightGBM | 0.964 [0.962, 0.967] | 0.906 [0.902, 0.909] | 0.900 [0.896, 0.904] | 0.809 [0.803, 0.815] |
| CatBoost | 0.964 [0.962, 0.967] | 0.908 [0.905, 0.910] | 0.897 [0.890, 0.903] | 0.802 [0.794, 0.810] |
Table 1: Model performance comparison on the CC18 and CTR23 benchmarks, with 95% confidence intervals. Tree-based models are taken from McElfresh et al., MLP-PLR and TabR are taken from the official implementation. TabPFN-v2 was run with the default setting SUBSAMPLE_SAMPLES = 10000 for inference. TabDPT has context size 2048 and ensemble size 8.
TabDPT is trained on real-world tabular data and we observe scaling laws similar to LLMs opening the door to training Internet-scale tabular foundation models:
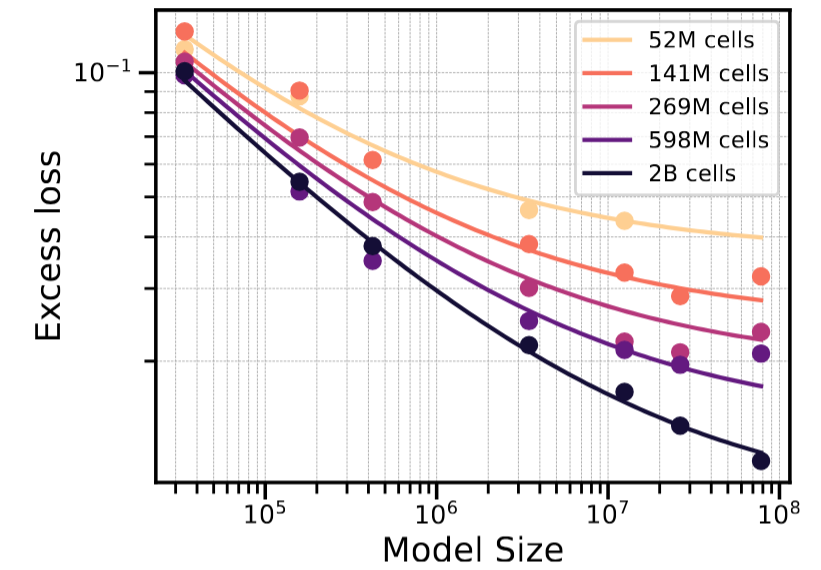
Figure 1: Increasing model or pre-training data size (number of cells) leads to consistent improvements predictable by power laws (fitted solid lines).
TabDPT also stands out in head-to-head model comparisons and is significantly faster than other models in total time taken to generate a prediction:

Figure 2: (left) Pairwise win-rate comparison in terms of classification/regression accuracy/R2. (right) Total runtime vs performance. TabDPT models are ordered by context size.
For full details, please see our paper TabDPT: Scaling Tabular Foundation Models on Real Data.
It is impossible to exactly replicate the results of TabDPT between runs, but this section describes how to generate results using the same evaluation approach as in the paper.
To install the dependency versions used in the paper, run
pip install .[reproduce-results]
This requires Python 3.11.
Running the paper_evaluation.py script will enable calculation of results similar to the paper. Run the following two commands:
python paper_evaluation.py --fold 0
python paper_evaluation.py --fold 1
and then use notebooks/analysis.ipynb with the resulting CSV outputs to reproduce the numbers (including confidence intervals) from the Appendix.
You can do something similar to get the ranked table from this README and the paper but will need to also compute the baseline results beforehand (code not provided in this repository).
@article{ma2024tabdpt,
  title={TabDPT: Scaling Tabular Foundation Models on Real Data},
  author={Ma, Junwei and Thomas, Valentin and Hosseinzadeh, Rasa and Kamkari, Hamidreza and Labach, Alex and Cresswell, Jesse C and Golestan, Keyvan and Yu, Guangwei and Caterini, Anthony L and Volkovs, Maksims},
  journal={arXiv preprint arXiv:2410.18164},
  year={2024}
}
© Copyright 2024-2025 The Toronto-Dominion Bank and/or its affiliates