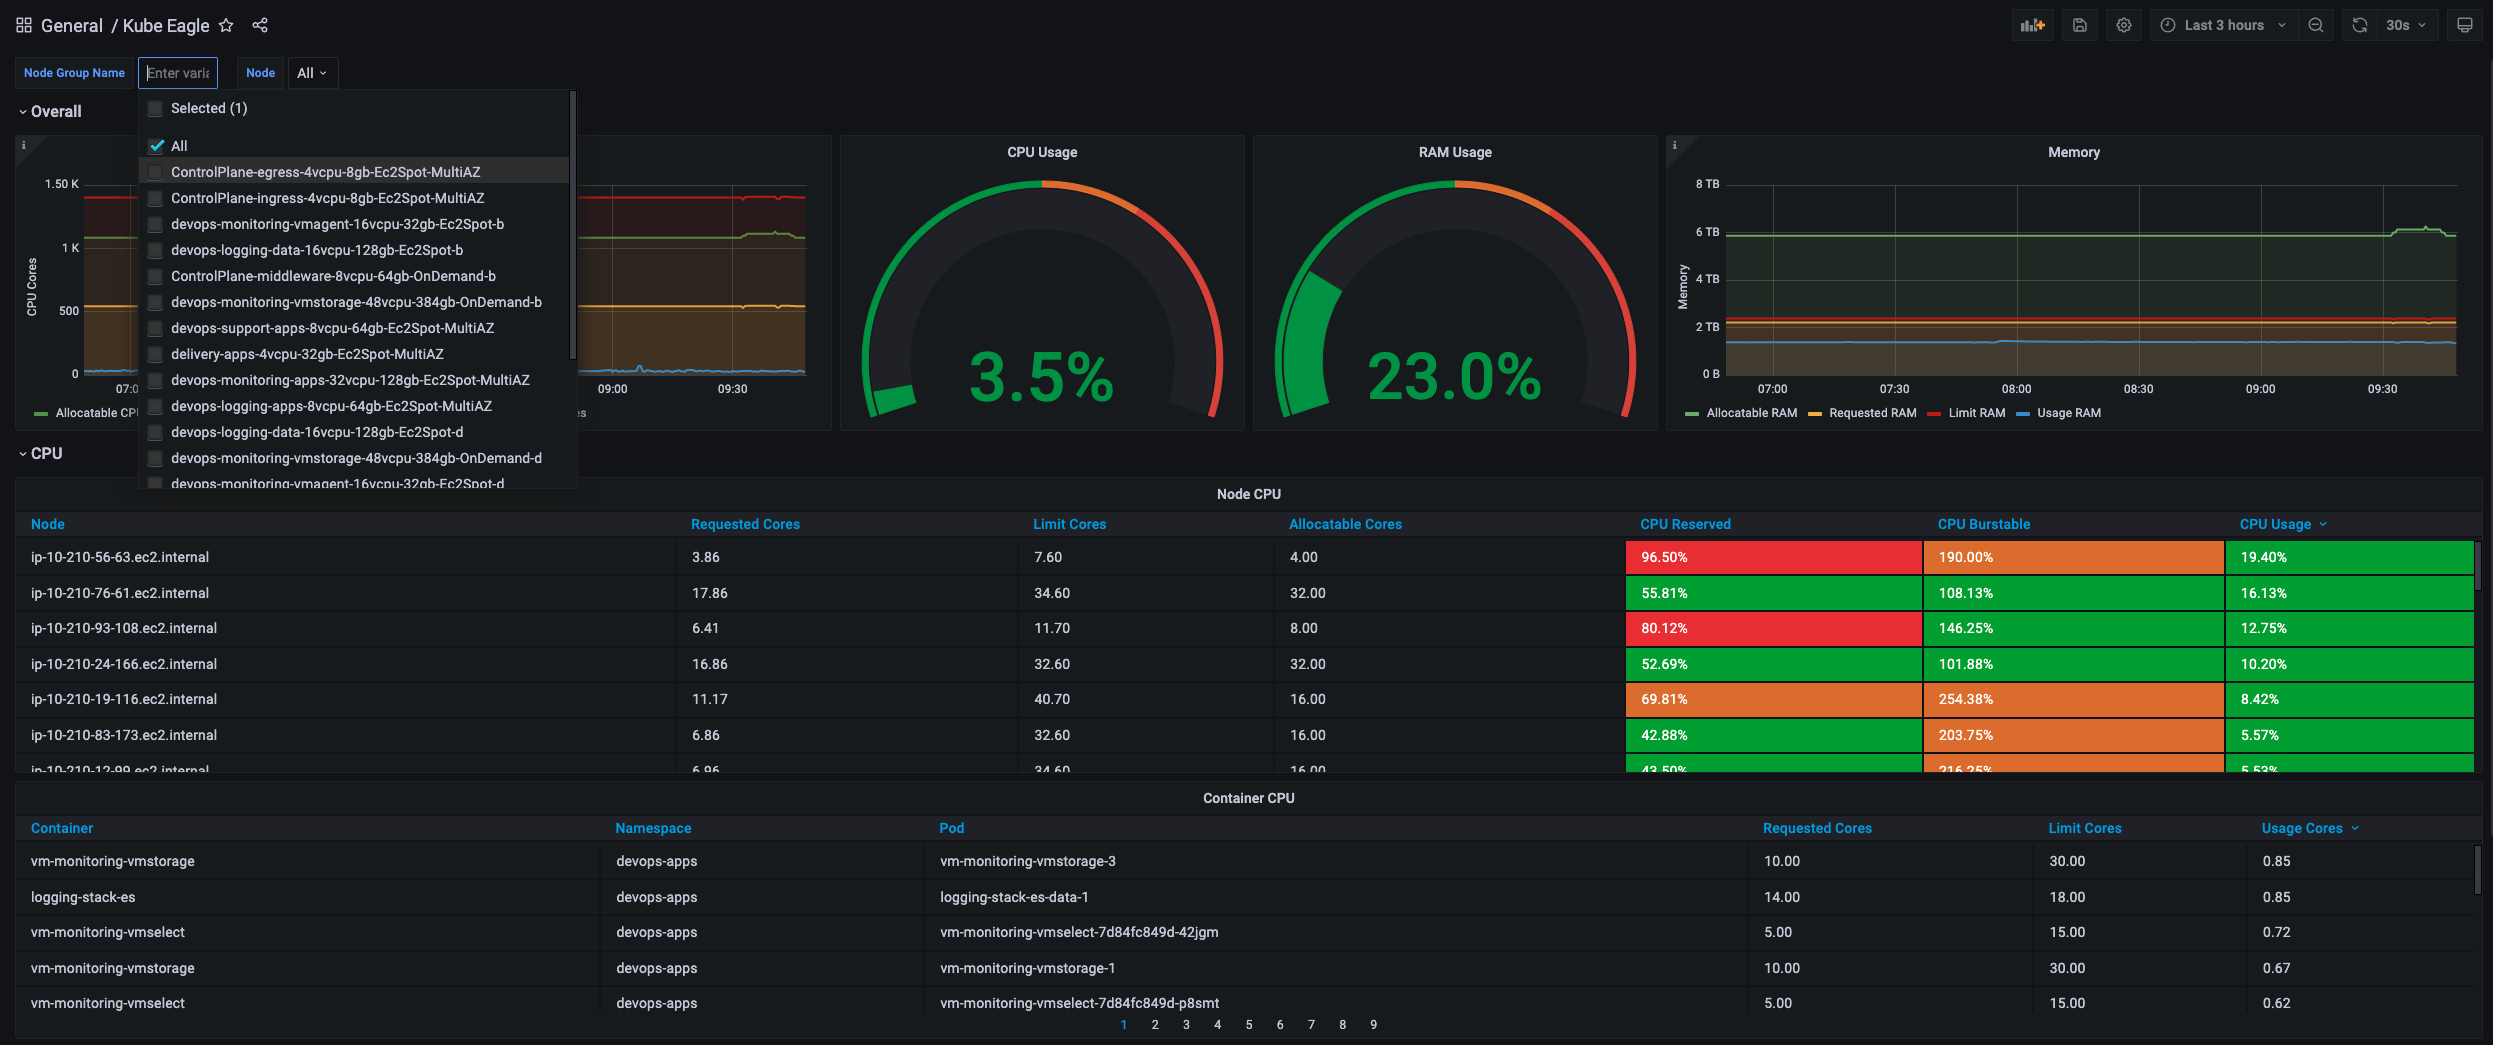
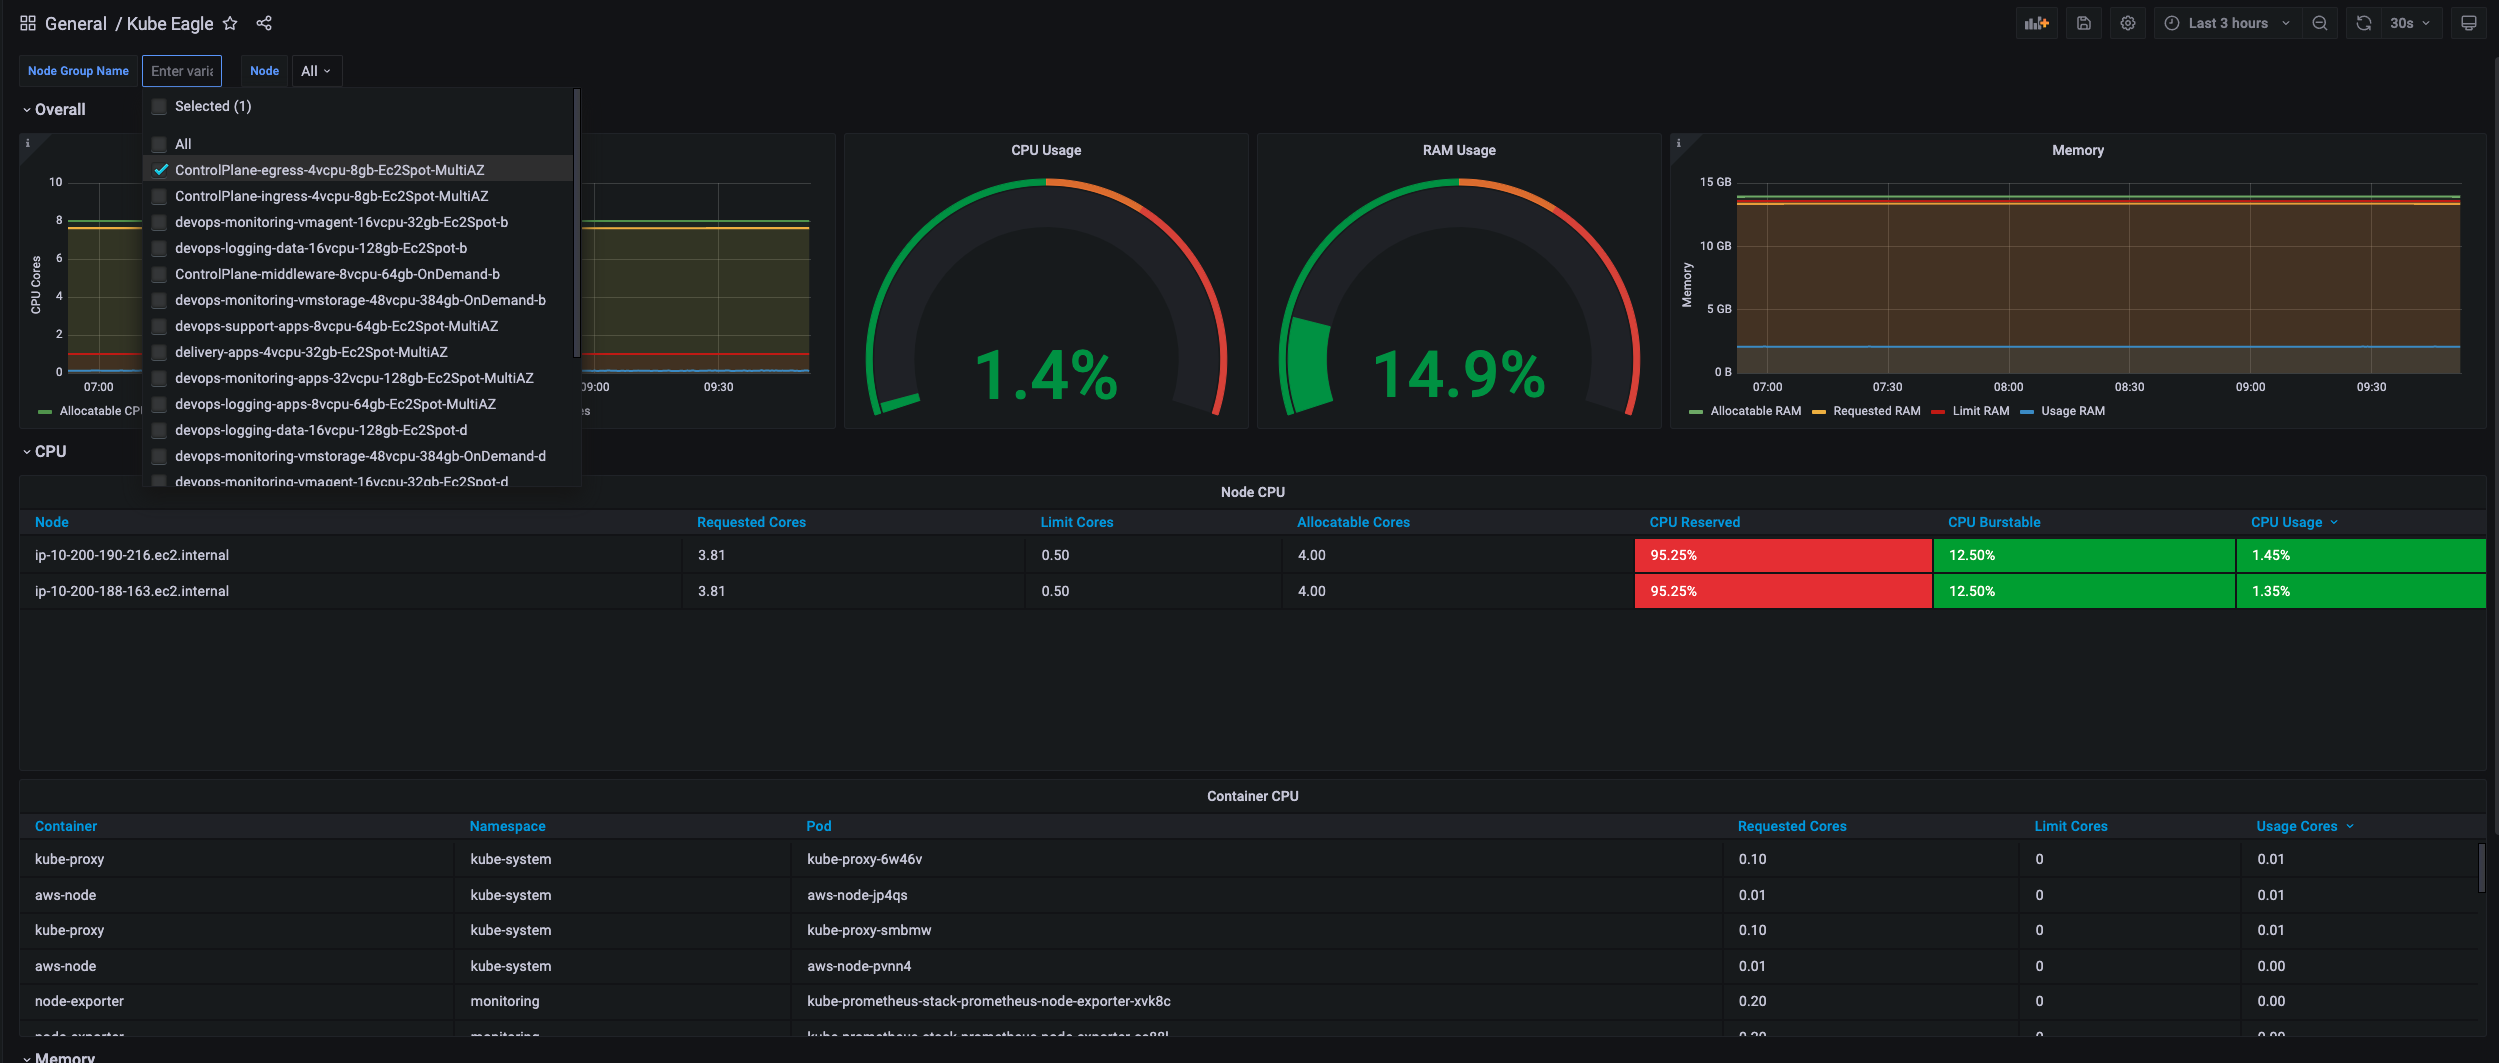
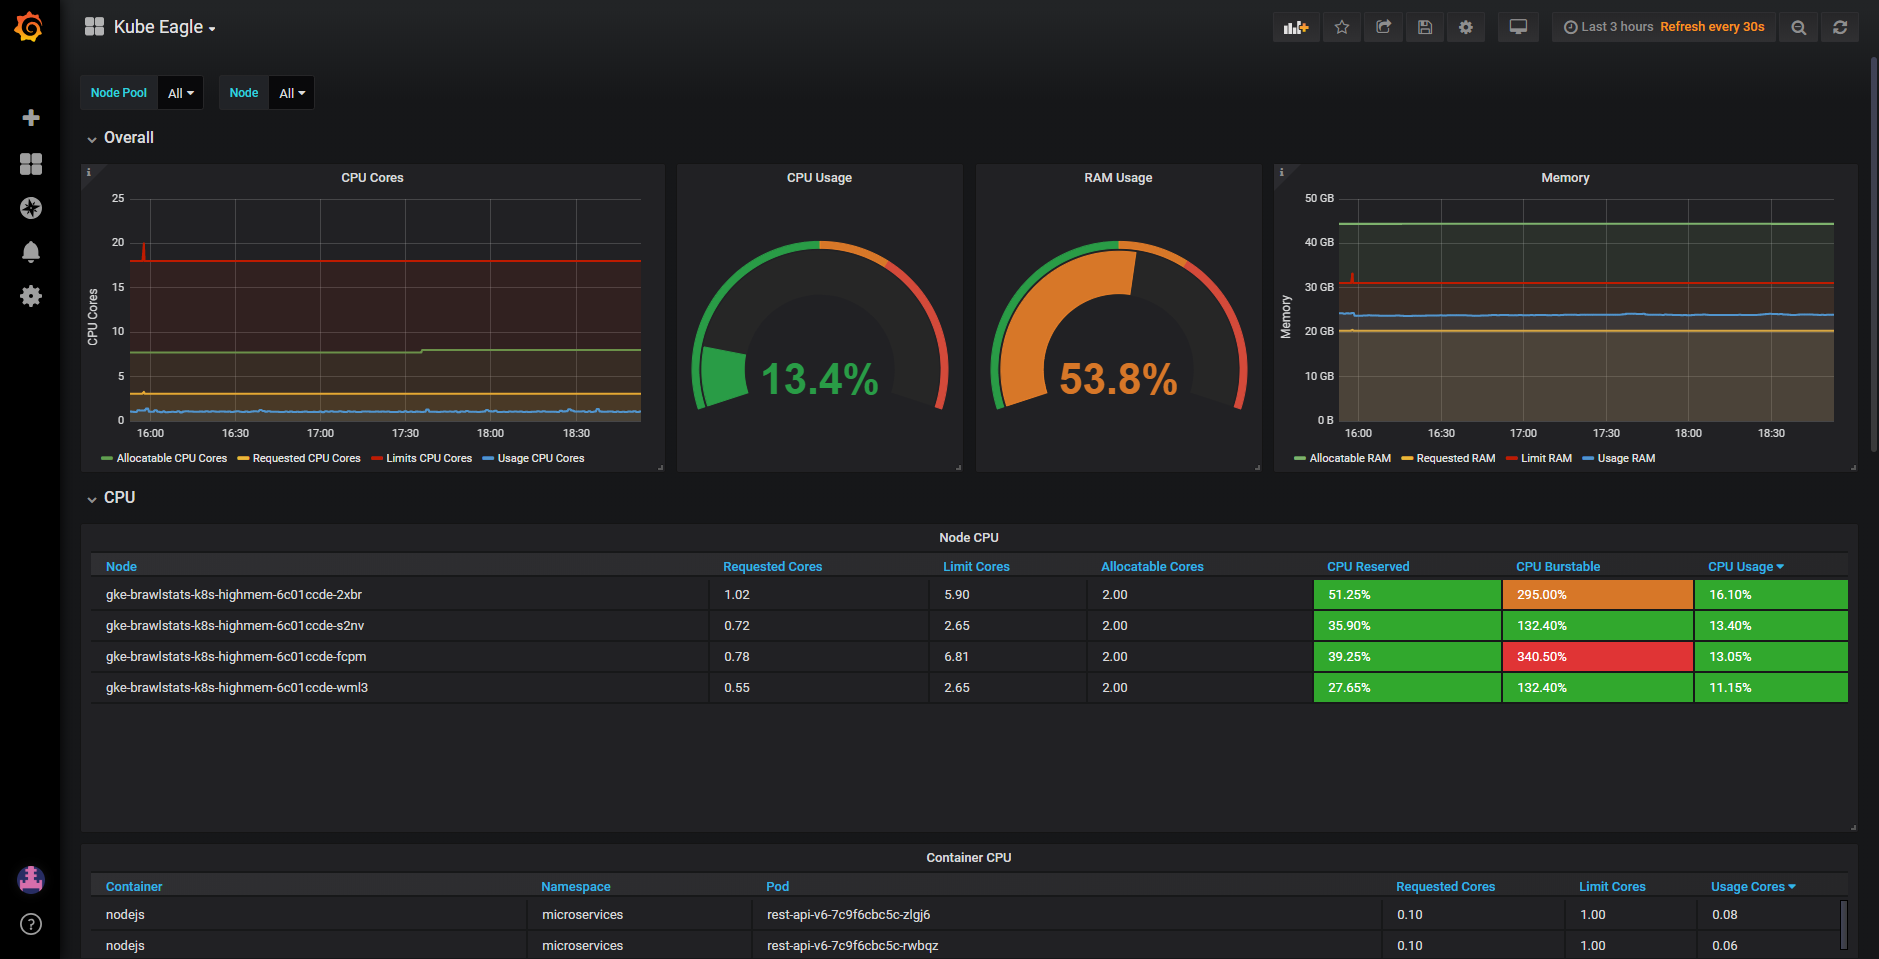
Kube eagle is a prometheus exporter which exports various metrics of kubernetes pod resource requests, limits and it's actual usages. It was created with the purpose to provide a better overview of your kubernetes cluster resources, so that you can optimize the resource allocation. You can easily build, or use our default grafana dashboard which will help you to achieve this goal:
This is a fork of https://github.com/cloudworkz/kube-eagle
It has one additional feature of adding the node-group label to all metrics.
This is useful for EKS deployments and allows filtering by node-groups.


Simply deploy a pod which runs kube-eagle inside the kubernetes cluster you would like to monitor. We recommend using our provided helm chart to deploy kube eagle in your cluster:
Kube eagle for EKS helm chart: https://github.com/liorfranko/kube-eagle-eks-helm-chart
Note: Metrics-server is a prerequisite for Kube Eagle to work. Most managed Kubernetes clusters come with metrics-server installed by default - you can find the associated helm chart in the helm stable repo.
Make sure the pod has a service account attached that has the required permissions. You can use our helm chart which is capable of creating the service account along with the required ClusterRole and ClusterRoleBinding.
| Variable name | Description | Default |
|---|---|---|
| TELEMETRY_HOST | Host to bind socket on for the prometheus exporter | 0.0.0.0 |
| TELEMETRY_PORT | Port to listen on for the prometheus exporter | 8080 |
| METRICS_NAMESPACE | Prefix of exposed prometheus metrics | eagle |
| IS_IN_CLUSTER | Whether to use in cluster communication or to look for a kubeconfig in home directory | true |
| LOG_LEVEL | Logger's log granularity (debug, info, warn, error, fatal, panic) | info |
| ENABLE_LABELS | Add pod's labels to eagle_pod_container metrics | false |
- Import the dashboard: https://grafana.com/grafana/dashboards/15463 (Dashboard ID 15463)
| Metric name | Description |
|---|---|
| eagle_node_resource_allocatable_cpu_cores | Allocatable CPU cores in Kubernetes |
| eagle_node_resource_allocatable_memory_bytes | Allocatable RAM in Kubernetes in bytes |
| eagle_node_resource_limits_cpu_cores | Total limit CPU cores of all specified pod resources on a node |
| eagle_node_resource_limits_memory_bytes | Total limit of RAM bytes of all specified pod resources on a node |
| eagle_node_resource_requests_cpu_cores | Total request of CPU cores of all specified pod resources on a node |
| eagle_node_resource_requests_memory_bytes | Total request of RAM bytes all specified pod resources on a node |
| eagle_node_resource_usage_cpu_cores | Total number of used CPU cores on a node |
| eagle_node_resource_usage_memory_bytes | Total number of RAM bytes used on a node |
| eagle_node_resource_usage_memory_bytes | Total number of RAM bytes used on a node |
| eagle_node_resource_usage_pod_count | Total number of running pods for each kubernetes node |
| eagle_pod_container_resource_limits_cpu_cores | Limit of CPU cores set for a specific container |
| eagle_pod_container_resource_limits_memory_bytes | Limit of RAM bytes set for a specific container |
| eagle_pod_container_resource_requests_cpu_cores | Requested CPU cores set for a specific container |
| eagle_pod_container_resource_requests_memory_bytes | Requested RAM bytes set for a specific container |
| eagle_pod_container_resource_usage_cpu_cores | CPU cores in use by a specific container |
Kube eagle talks to the kubernetes master(s) using the official kubernetes go client. Every time the /metrics endpoint is hit Kube Eagle sends requests to the k8s masters to get pod & node resource objects as well as the pod & node usage list. Kube eagle aggregates and brings together the collected data so that they can be attached as prometheus labels. This way it's easy to create grafana dashboards which help you to optimize your resource allocations.
MIT License
Copyright (c) 2020
Permission is hereby granted, free of charge, to any person obtaining a copy of this software and associated documentation files (the "Software"), to deal in the Software without restriction, including without limitation the rights to use, copy, modify, merge, publish, distribute, sublicense, and/or sell copies of the Software, and to permit persons to whom the Software is furnished to do so, subject to the following conditions:
The above copyright notice and this permission notice shall be included in all copies or substantial portions of the Software.
THE SOFTWARE IS PROVIDED "AS IS", WITHOUT WARRANTY OF ANY KIND, EXPRESS OR IMPLIED, INCLUDING BUT NOT LIMITED TO THE WARRANTIES OF MERCHANTABILITY, FITNESS FOR A PARTICULAR PURPOSE AND NONINFRINGEMENT. IN NO EVENT SHALL THE AUTHORS OR COPYRIGHT HOLDERS BE LIABLE FOR ANY CLAIM, DAMAGES OR OTHER LIABILITY, WHETHER IN AN ACTION OF CONTRACT, TORT OR OTHERWISE, ARISING FROM, OUT OF OR IN CONNECTION WITH THE SOFTWARE OR THE USE OR OTHER DEALINGS IN THE SOFTWARE.

