Are you looking for a demo of a powerful data management app for your fashion business? Look no further!
Introducing the Data Management Application built using the MERN stack (Mongodb, Express, React, and Node). This app allows administrators to have a comprehensive overview of their business with all the relevant data about their products, customers, and transactions.
With a sleek and modern design using Material UI, the app is not only functional but visually appealing as well. Check out the demo for yourself: https://datanexus.vercel.app/.
Link to the management app's demo: https://datanexus.vercel.app/

Link to the frontend's repo: https://github.com/hiluan/datanexus-admin-dashboard-frontend Link to the backend's repo: https://github.com/hiluan/datanexus-admin-dashboard-backend
Features
-
Dashboard Page with different stats (line chart, transaction table, and pie chart)
-
Products Page to view a list of products with rating, description, name, and category
-
Customers Page with a material UI data grid to view and manage customers data
-
Transaction Page with server-side pagination
-
Geography Page to view where users are located using nivo geography chart
-
Line Charts to view revenue by month and the ability to swap between sales and units
-
Daily Chart to choose different ranges of dates for daily sales
-
Monthly Chart and a breakdown of the pie chart
-
Admin Chart/Table and Performance Table using aggregate calls in Mongo database
-
Toggle dark mode/light mode
-
Toggle on/off Sidebar using material UI's Sidebar
-
Fully responsive design
-
Entity relationship diagram to organize the backend data
-
Deployment of the application onto Render.com
-
Server-side pagination
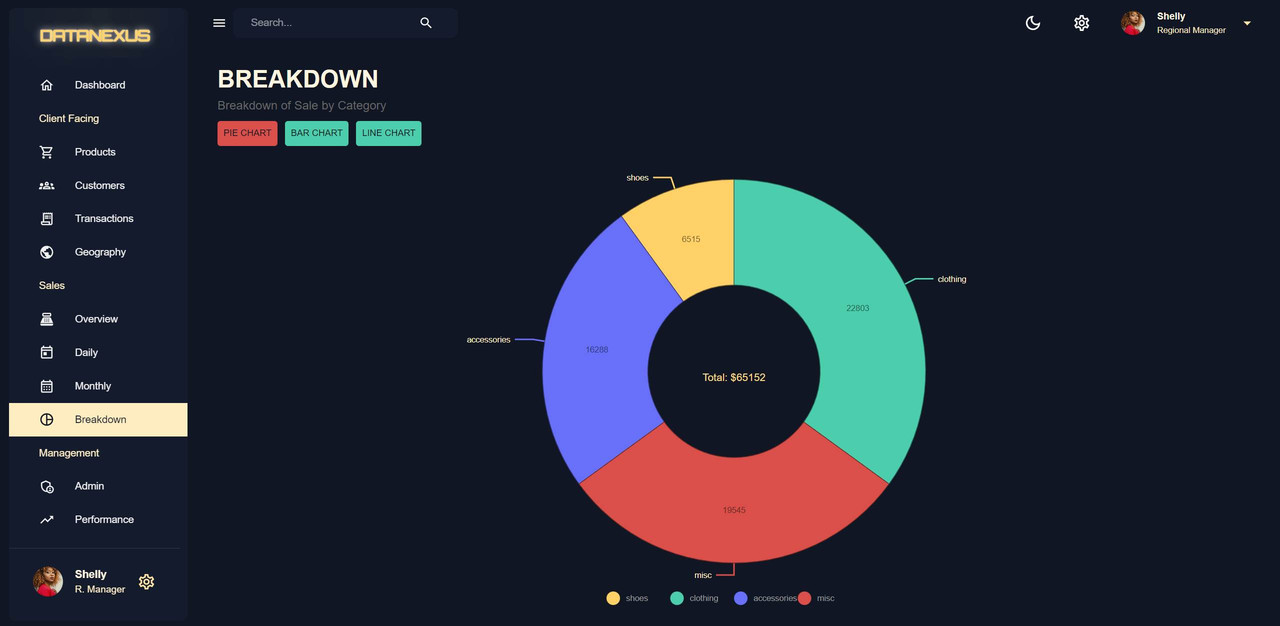
Breakdown Pie Chart
Technologies used:
- Front-end:
- React: Used for front-end development.
- Material UI: Used for styling.
- Material UI Data Grid: Used for data tables.
- Nivo: Used for charts.
- Redux Toolkit: Used for State Management and API Calls.
- Redux Toolkit Query: Used to make API calls to the backend.
- Back-end:
- Node.js: Used as the runtime environment.
- Express.js: Used as the backend framework.
- Mongoose: Used for managing the MongoDB database.
- MongoDB: Used for database management.
-
ERD Diagram and Data Modeling
ERD (entity-relationship diagram) and Data Modeling involves organizing data before coding to create a clean and accessible database for different use cases. It involves separating data and establishing relationships between tables, similar to SQL databases, for increased speeds and efficiency. In this case, I'm using a nosql database but formatting it as if it were an SQL database. Here is how a user model and separated transactions and products are created into their own tables to keep the data organized and easily accessible:
https://lucid.app/lucidchart/81ff5432-cc50-4c41-a7b8-7258fec1e630/view?page=0_0#
-
Redux Toolkit
Redux Toolkit: Colors and MUI Light & Dark Mode Themes
The process of creating a dark mode and light mode using
Redux Toolkitinvolves creating atheme.jsfile in the client directory. In this file, colors are generated using Tailwind shades to create a color palette. This color palette includes primary, secondary, neutral, and background colors. The palette is then set up in a way that it can be used in Material UI.A custom function is created to reverse the token colors for light mode. In the
theme.jsfile,Typographyis also set up using a Google font and font sizes are specified for each heading. Thetheme.jsfile will be used throughout the project to adjust colors based on the light or dark mode setting.Redux Toolkit Query
Redux Toolkit plays a crucial role in implementing a user information feature in the project. It begins with adding the user ID in the state, followed by creating a user ID route in the back end. The user data is represented through a Mongoose schema, which contains properties such as name, email, password, city, occupation, phone number, transactions, role, and a timestamp. The role is restricted to three values: user, admin, or super admin.
API calls are facilitated through the setup of a reducer path, tag types, and endpoint in the API file. The endpoint contains the main logic for the API calls, including the path and tag identification value. The necessary values are imported into the
index.jsfile and set up with listeners, API, middleware, and listeners. The API call is then made in theindex.jsxfile in thecomponentsfolder by importing theuseGetUserQuery.User information is added to the Sidebar and Navbar components, including a profile image, username, occupation, and a setting icon.
anchorEl,useState(), and handle click function for opening and closing the dropdown menu. The CSS styling for the button in the Navbar is added, making it a big button with similar styling to the Sidebar component, but with slight changes in width and height. The rest of the user information, including the username and occupation, is copied and pasted to the button in the Navbar.
-
Navigation with Navbar
The Navbar is built using
react-router-domand Material UI components. It utilizes browser routing, wrapped around a theme provider and single layer route. The route is designed with the layout component as its parent, ensuring that the Navbar and Sidebar exist on every page. There are two routes created, one that navigates to the dashboard and one for the dashboard itself. The process involves creating a dashboard component and layout component in the source directory. CSS styling techniques such as Flexbox and CSS shorthands are used to create a visually appealing design. Functions for toggling the Sidebar and switching between dark and light modes have been implemented, along with a search bar and settings button. The Navbar is fully functional when the Sidebar or mode buttons are clicked.Mobile Responsive with Sidebar
-
Navigation with Sidebar
Sidebar is built as a persistent drawer component for ease of navigation on both mobile and desktop screens. The component is made up of various items imported from the Material UI library, including cons, Typography, Drawer, and more. A media query is used to determine if the screen is on a mobile or desktop device, and the state of the Sidebar is set to either open or closed. The state is then passed into the Navbar component to allow for opening and closing of the Sidebar using the menu icon.
A list component loops through a list of navigation items, creating a component for each one. The navigation items include dashboard, client-facing, products, customers, transactions, geography, sales, overview, daily, monthly, breakdown, management, admin, performance, and more. The list items are either represented with an icon or a title, and hovering and clicking on the items allows for access to different pages.
-
Products Page
The Product Page is created to store and display information about products in a database. The product model includes details such as name, price, description, category, rating, and supply. The product stat model includes data on yearly, monthly, and daily sales. The products component is imported into the main file and uses Material UI components, such as
Box,Card,Actions, andTypography, along with theuseState()hook and theuseGetProductsQuery. AHeadercomponent is created for reuse on every page and the product page is made responsive using the CSS Grid layout andsxproperty. The product component is mapped through and contains information on the product's ID, name, description, price, rating, category, supply, and stat. It is represented by a card with a background color and foreign radius, set using the theme palette for responsiveness in dark or light mode. -
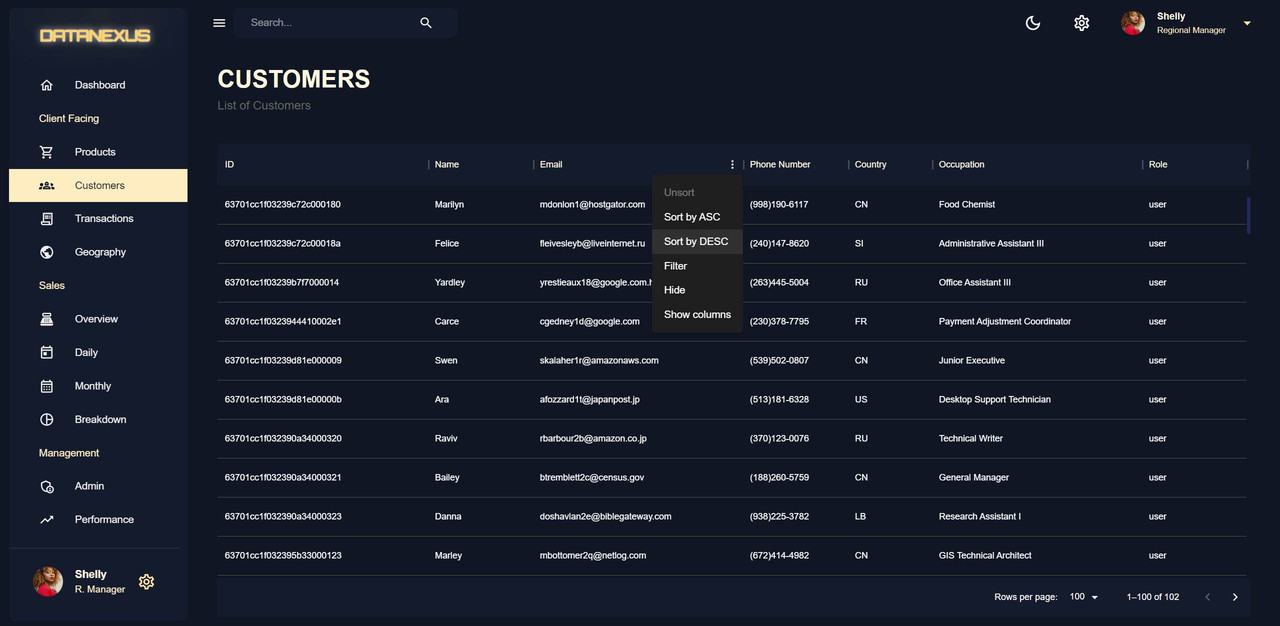
Customers Page
The Customers Page displays information about all customers in a Material UI table component, also known as a data grid. This page is created by adding a route in the
client.jsfile and importing a get customers function from thecontrollers. The information is retrieved from the backend through the use of the user model and the try-catch block. The password information is not included in the response to ensure security. The front end then accesses the data from the customers API endpoint using theuseGetCustomersQueryhook. In theapp.jsfile, the customers route is linked to the customers folder andindex.jsxfile. The data and loading information is pulled from the hook and the final result is the display of customer information in a data grid format. -
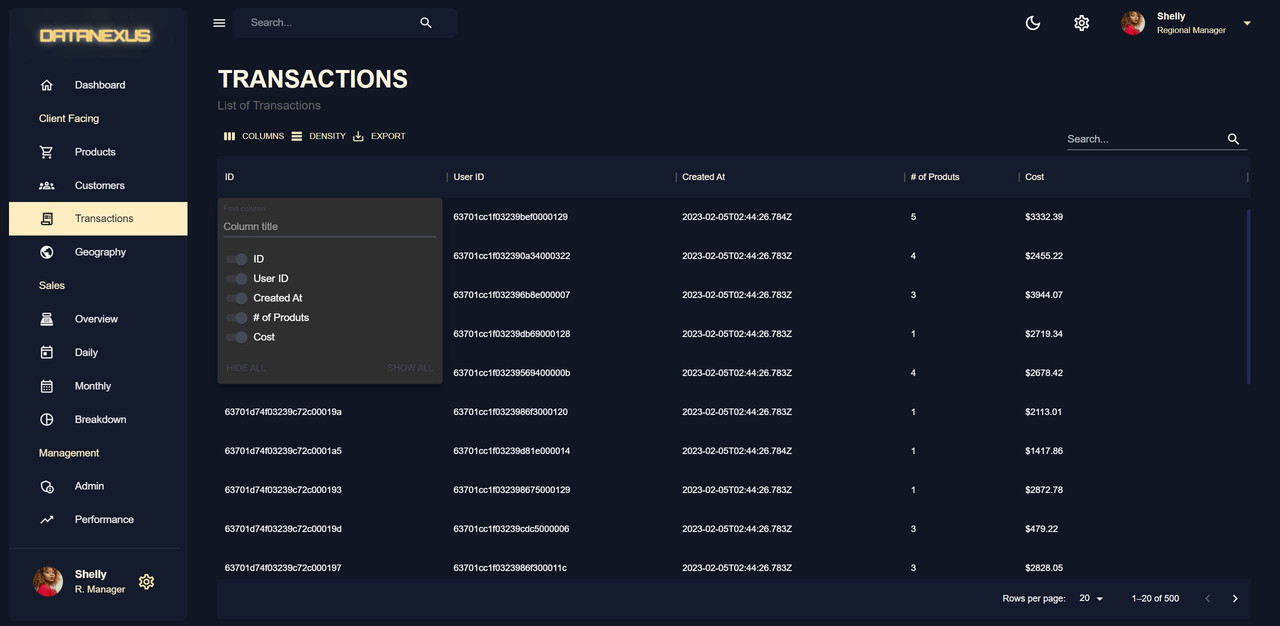
Transactions Page
The Transactions Page is a feature-rich data grid that is used to display transaction data. It has features such as column control, density control, data export to CSV, and a search function.The data grid has columns for user ID, created at, products, number of products, and cost, and the cost column has a formatted display of the transaction cost. The data grid is contained in a box component with the title "Transactions" and subtitle "Entire List of Transactions". The data grid component is set to display the transaction data with properties such as loading, get row ID, rows, and data.
Server side pagination is used on the Transactions Page because it is more efficient and practical when dealing with a large amount of data. When using client-side pagination, all of the information is sent to the front end at once, which can slow down the process and cost too much. With server-side pagination, only 20 pages of information are sent to the front end at a time, and when the user clicks next, new information is sent from the back end. This reduces the amount of data sent to the front end, making the process faster and more cost-effective. The sorting and filtering are also done on the back end, and the page number is communicated to the back end, making the process even more efficient.
-
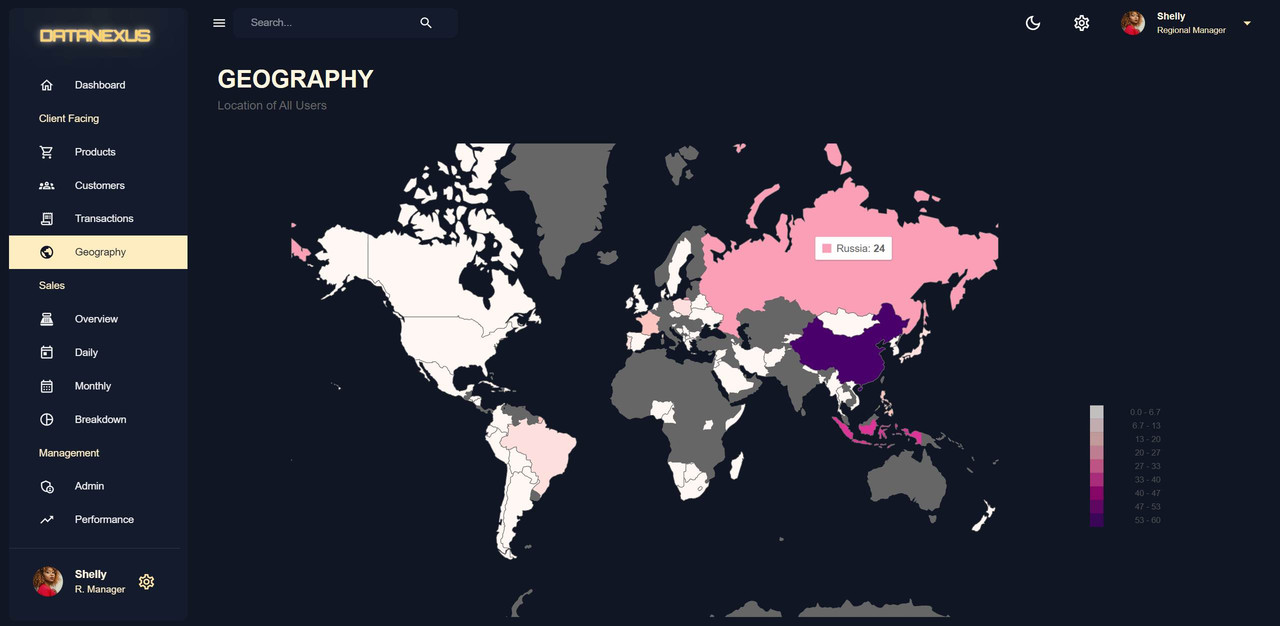
Geography
The Geography Page displays information about the location of the users based on their information. The chart shows the number of users from different locations, which is helpful in understanding where the users are located. The information about the country of the users is stored in the user information and there is no need to create a new model for this purpose. A function has been created to format the data in a way that is suitable for the Nivo charts. A package called country-ISO-2-3 has been installed to convert the two-letter country symbol to three-letter country symbol. The function uses the reduce method in JavaScript to add the data to an accumulator object that is then passed along to each iteration.
-
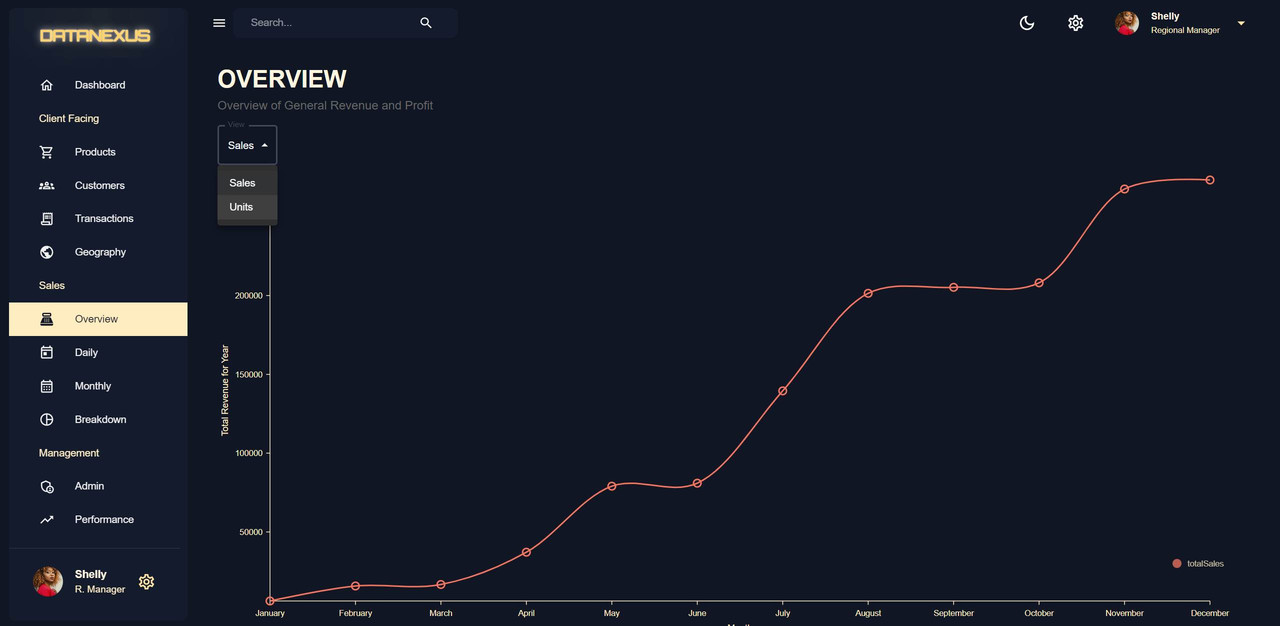
Overview Page
The Overview Page displays the overall revenue and profit of the year. It has two different views: units and sales. The data includes total customers, yearly sales total, yearly total sold units, year, monthly data, and sales by category. This data is saved in the MongoDB database and can be retrieved through an endpoint named
getSales. ThegetSalesfunction in thesales.jsfile in the controllers folder is used to retrieve the data from the MongoDB database and return it to the user. The line chart displaying the total sales and total units is created using the monthly data from the sales endpoint.useMemo()is used to optimize the performance of the page. It allows for the calculation or data processing of the line chart, transaction table, and pie chart to only occur when there is a change in the input data, rather than on every render. This helps to prevent unnecessary re-renders and improves the overall performance and efficiency of the page. -
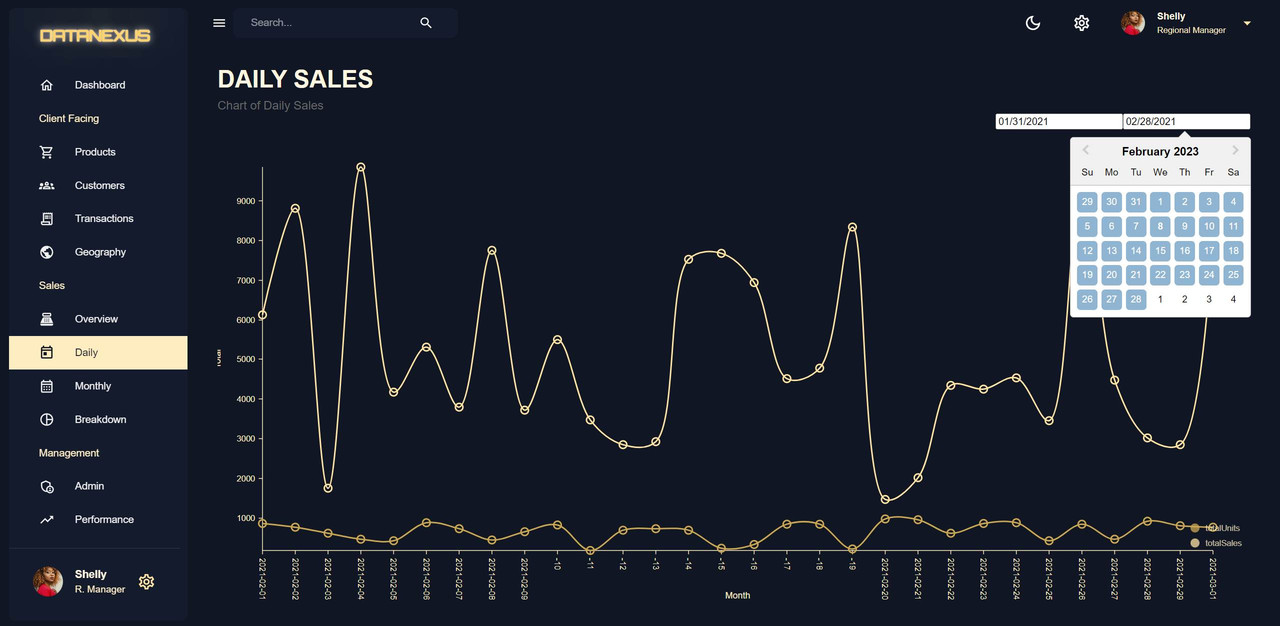
Daily Page
The Daily Page is a component in a web application that displays sales information on a daily basis. It uses the
useGetSalesQueryto retrieve data from an API endpoint and thereact-date-pickerlibrary to allow users to select a range of dates for which they want to see the sales information. The component is created in a new folder called "daily" and the file is namedindex.jsxThe component usesuseState()to keep track of the start and end dates, and the data from the API is massaged and formatted for display in a chart usinguseMemo(). The component is not used in the Dashboard Page, so it is created within the "scenes" folder and not in the "components" folder. Thereact-date-pickerlibrary requires the import of its CSS, which is also included in the component.useMemo()is used here to optimize performance by avoiding unnecessary re-renders of the component. It is used in conjunction with the daily chart data, which is passed as a prop to the component. By usinguseMemo(), the component will only re-render when the daily chart data changes, rather than on every update of the component. This optimization helps to improve the performance and overall user experience of the application. -
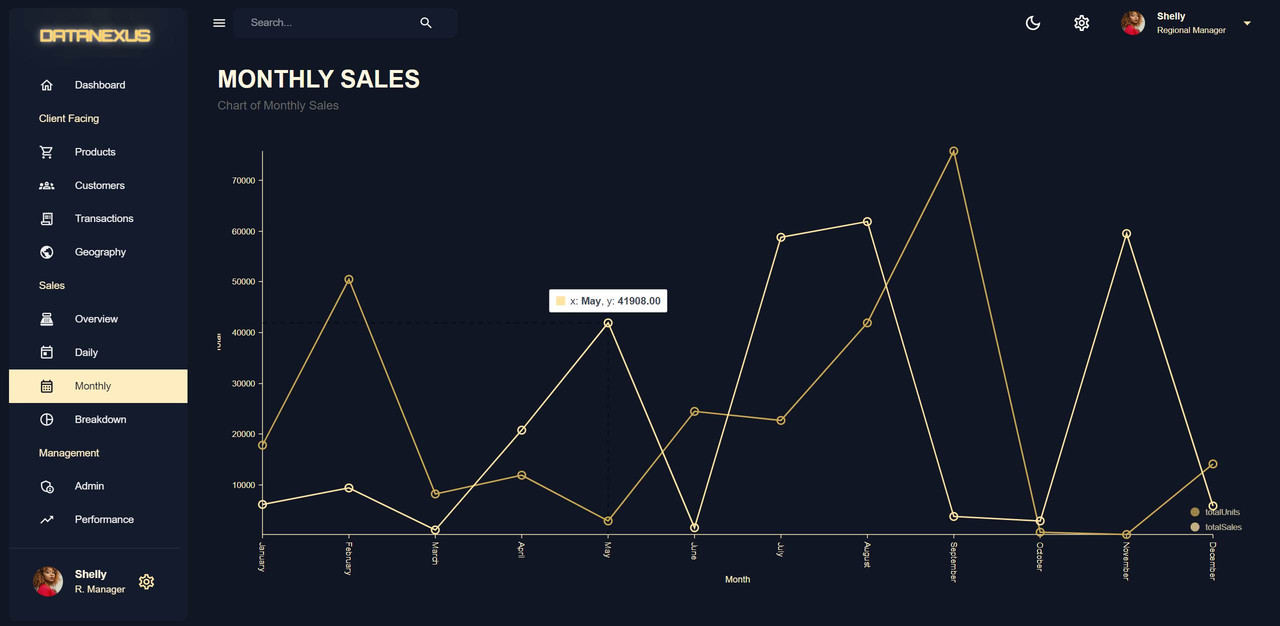
Monthly Page
The Monthly Page is a variation of the Daily Page in a sales dashboard. The Monthly Page displays the total sales and total units sold for each month. The range information from the Daily Page is not needed for the Monthly Page and is removed. The format of the date is kept the same, with the date being changed to the month. The monthly sales information is displayed in a line chart, but can also be adjusted to display in a non-curved chart. The information displayed in the Monthly Page is cached using the Redux Toolkit query, meaning that the API call to retrieve the data is only made once, saving time and resources.
-
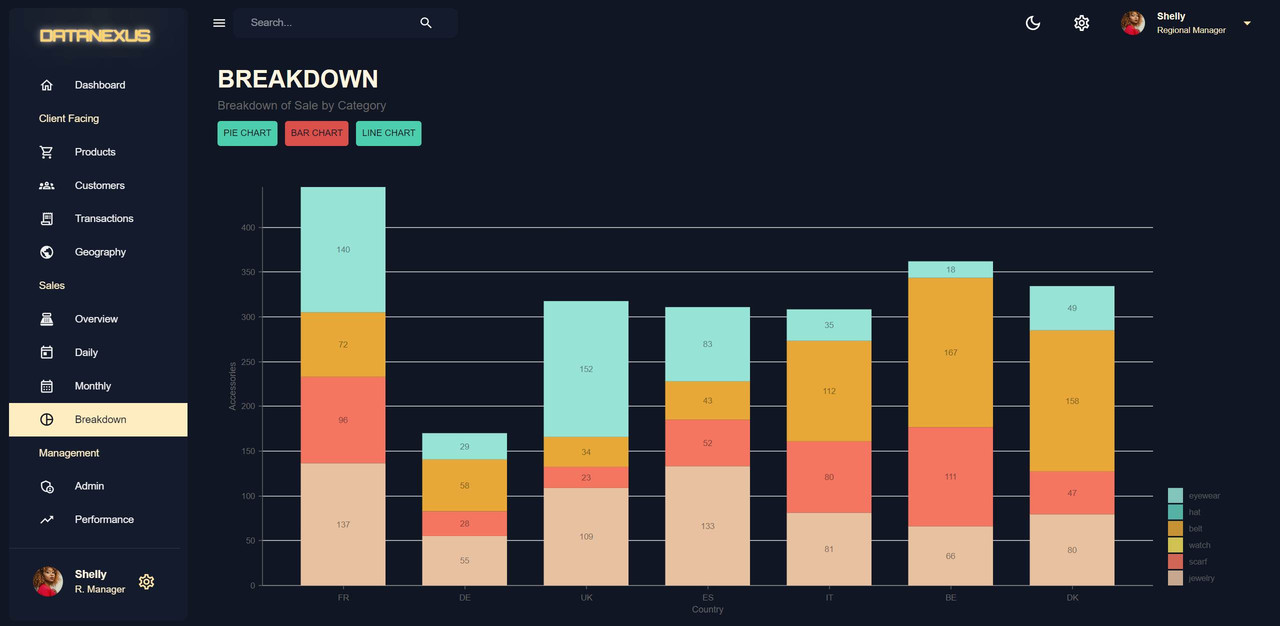
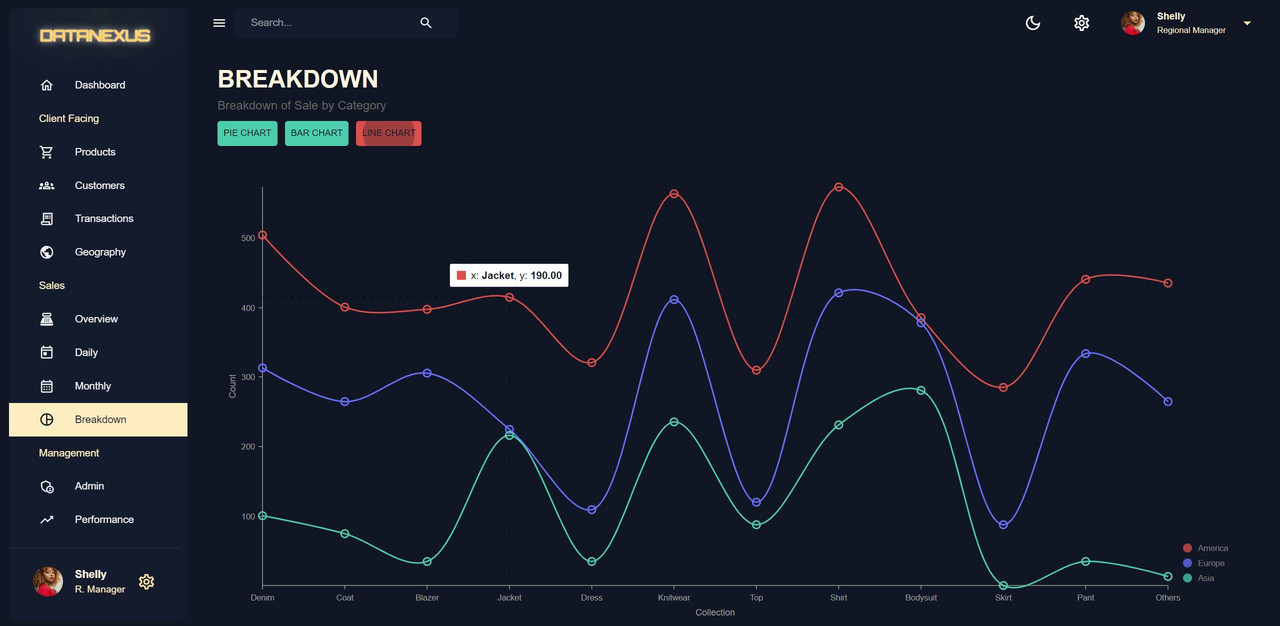
Breakdown Page
The Breakdown Page is a section in the dashboard that shows the sales breakdown by categories. The breakdown chart is a pie chart that displays the information split into categories. The chart information is displayed in the middle to show the total amount of sales. The breakdown chart is created as a separate component in the
componentsfolder calledBreakdownChart.jsx. The chart is created using the Nivo library and the chart data is formatted as an array of objects with ID, label, value, and color. The chart displays the information in a pie chart format for easy visualization. -
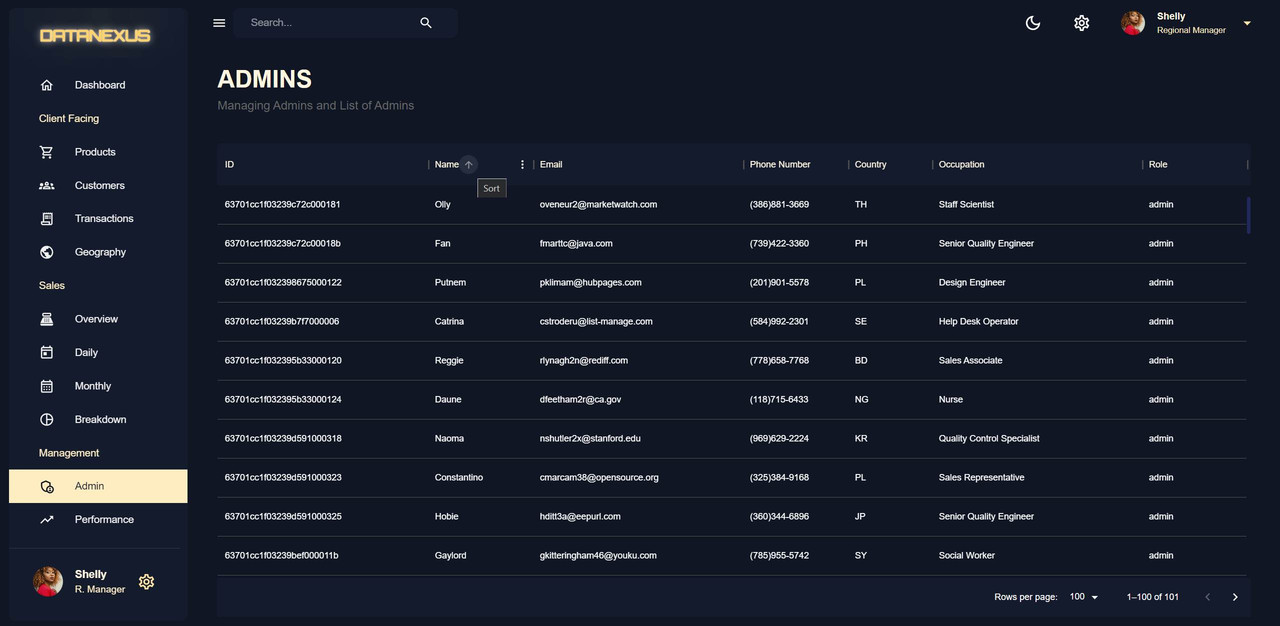
Admin Page
The Admin Page is a data grid table that displays information about the administrators of a particular user. The information is obtained by making a
GETcall to the server and calling thegetAdminsfunction from themanagement.jsfile in thecontrollersfolder. The data is obtained by using Mongoose to find the users with the role of admin and selecting all the information except for the password. TheGETcall is performed by importing theuseGetAdminsQueryfrom the API and then using it to fetch the data. The data is then displayed in a data grid using MUI-X Data Grid. -
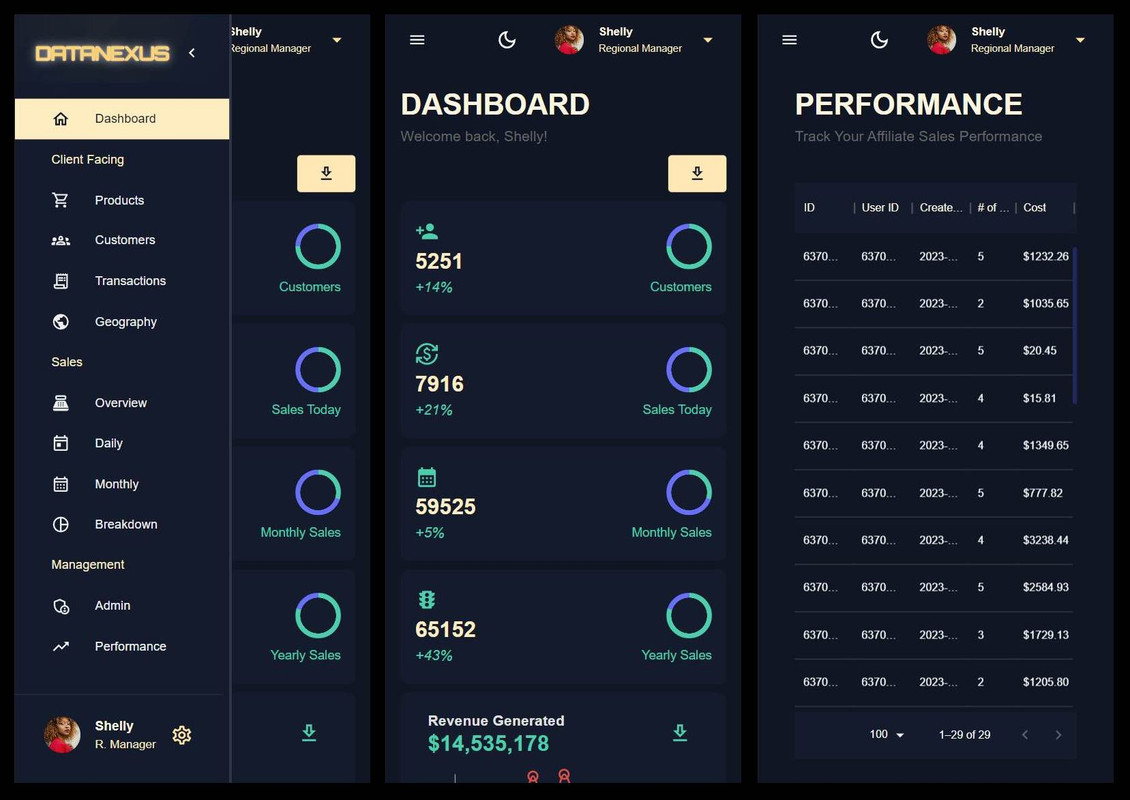
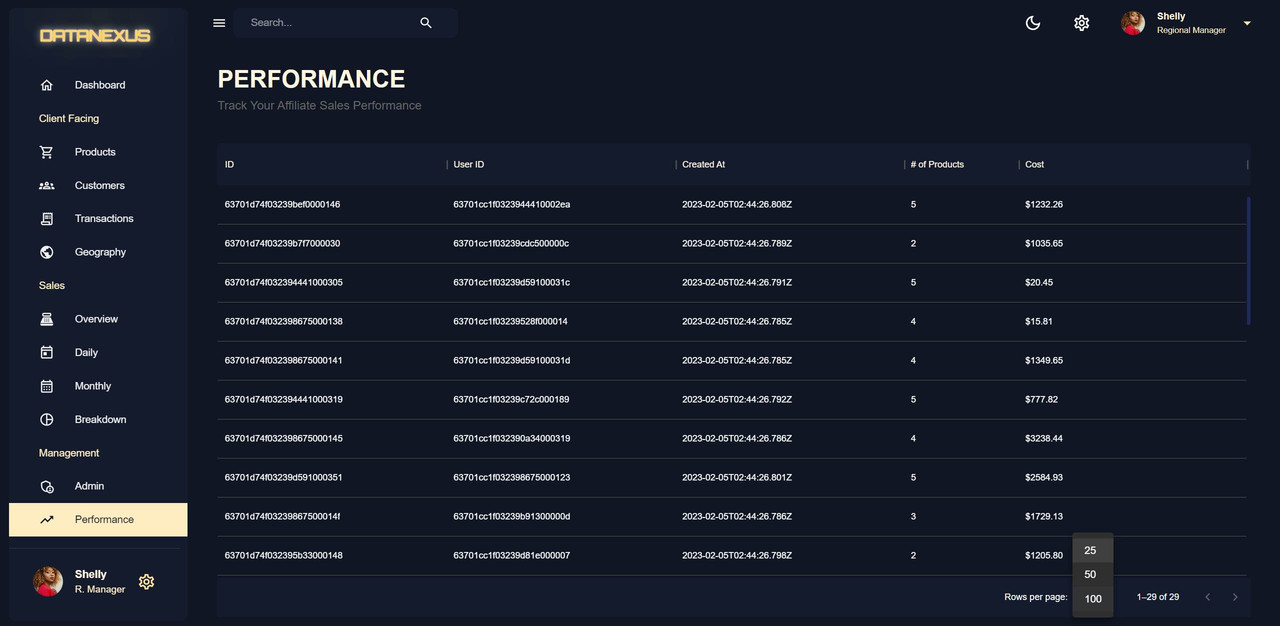
Performance Page
The Performance Page is a data grid that shows the performance of a specific user. It will show the number of sales that the user has made. To create the performance page, a new model called
AffiliateStatis created in the backend. TheAffiliateStatmodel is connected to theUserandTransactionmodels through object IDs. TheuserIDis a one-to-one relationship and theaffiliatesalesis a one-to-many relationship with theTransactionmodel. TheAffiliateStatinformation is inserted into the database and a new route is created for the performance page with a get request.Aggregatecalls are similar toJOINin SQL and they allow you to combine and aggregate information from multiple database tables. The get user performance function uses theuser.aggregatefunction and the aggregation pipeline to retrieve the performance information of the user with the specific ID passed in from the front end through the query params. -
Dashboard Page
The Dashboard Page displays various statistics and information about the website in a visually appealing way. This information is obtained from the server by making an API call to a specific endpoint, which retrieves data from data tables such as the
OverallStatandTransactionstables. The information is then returned to the front-end in a JSON format for the Dashboard Page to display. The Dashboard Page displays the total number of customers, the yearly total sold units and sales, the monthly and today's stats, and the latest 50 transactions. The revenue and sales by category information are displayed using the line chart and pie chart respectively. The stat boxes in the Dashboard Page are created using a new component called stat box, which uses Material UI's box, typography, and use theme, as well as Flex between as a style component. The stat boxes display information such as the total customers, sales today, monthly sales, yearly sales, and traffic. -
Deployment
The deployment process involves hosting the backend API on Render.com and frontend on Vercel.app. It is important to ensure that the local environment variables are not pushed to the server by creating a
.gitignorefile and ignoring certain files such as/node_modulesand.env. The code is then pushed to a GitHub repository and the deployment process can begin.

In this full stack admin dashboard application, several optimizations have been made to ensure efficient and effective data management and display. Firstly, the use of an entity relationship diagram to organize the backend data models saves time and ensures well-organized data. Additionally, server-side pagination is used in the transaction page, which is a more complex and advanced method compared to most tutorials.
In terms of performance, aggregate calls in MongoDB are used to manage information in the performance table, making it more efficient. The front end is styled using Material UI and data tables are displayed using Material UI data grid. The charts in the geography page, monthly and daily charts, and pie chart breakdowns are displayed using Nivo. The state management is handled by Redux Toolkit and API calls are made using Redux Toolkit query.
The backend is powered by Node.js as the runtime, Express.js as the backend framework, and Mongoose for managing MongoDB. The front end is built using React and the app is fully responsive, with the ability to toggle on and off the Sidebar using Material UI's Sidebar.
Overall, these optimizations make this full stack admin dashboard application a well-designed and efficient solution for data management and display.
-
Data Management: Working with MongoDB, Express.js and Mongoose taught me about the importance of organizing and managing data effectively in a database.
-
API Integration: Integrating API calls with the front-end using Redux Toolkit and Redux Toolkit Query helped me understand how to retrieve and display data efficiently from the back-end to the front-end.
-
Data Visualization: Using Nivo for chart visualizations and Material UI Data Grid for data tables taught me about different ways to display data in a visually appealing manner.
-
Entity Relationship Diagram: Using an Entity Relationship Diagram to model data taught me the importance of having a clear understanding of the relationships between different data entities.
-
Server-side Pagination: Implementing server-side pagination in the transaction page taught me about the challenges of paginating data on the server-side and how to overcome them.
Take a look at these examples that I have in my portfolio:
nurbier.vercel.app - Fullstack Ecommerce WebApp https://github.com/hiluan/nurbier-ecommerce-webapp-frontend
hiluan.dev - Portfolio Page https://github.com/hiluan/hiluan-frontend
starlite.netlify.app - Online Trading Platform https://github.com/hiluan/starlite-frontend