A simple, declarative charting library that works purely with HTML data attributes. DivChart is an easy way, to render data in a simple graph.
- Pure HTML data attributes (or props w/ React) configuration
- Automatic axes and labels
- Interactive tooltips
- Responsive design
- React support
- Zero dependencies
- Lightweight
npm install divchartThen import and use in your project:
import { DivChart } from 'divchart';Note: there is a dedicated React component. Instructions for that are detailed below.
Add the script directly into your HTML:
<script src="https://unpkg.com/divchart"></script>Simply add data attributes to your div:
<div class="chart"
data-divchart="line"
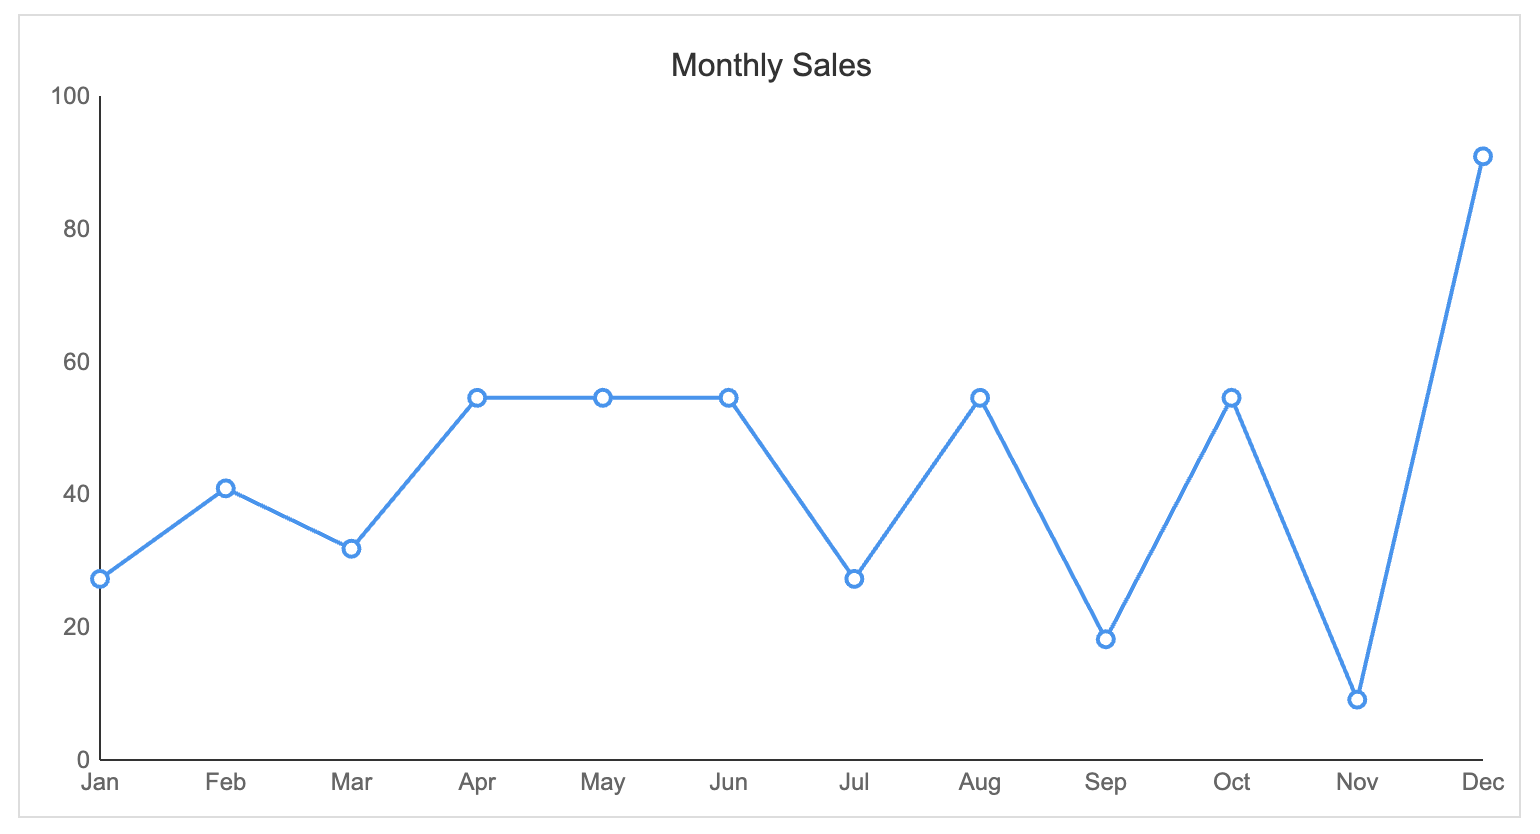
data-divchart-title="Monthly Sales"
data-divchart-data='[
{"label": "Jan", "value": 30},
{"label": "Feb", "value": 45},
{"label": "Mar", "value": 35},
{"label": "Apr", "value": 60},
{"label": "May", "value": 60},
{"label": "Jun", "value": 60},
{"label": "Jul", "value": 30},
{"label": "Aug", "value": 60},
{"label": "Sep", "value": 20},
{"label": "Oct", "value": 60},
{"label": "Nov", "value": 10},
{"label": "Dec", "value": 100}
]'
data-divchart-colors='["#2196F3"]'>
</div>This generates the following chart:
Import DivChart and use it directly in your React components:
import { Chart } from 'divchart';

function App() {
  const data = [
    { label: "Jan", value: 30 },
    { label: "Feb", value: 45 }
  ];

  return (
    <div className="App">
      <Chart
        type="bar"
        data={data}
        title="Test Chart"
        style={{ width: '600px', height: '400px' }}
      />
    </div>
  );
}
Feel free to wrap the div (or component) in any stylized tags e.g. placing a border around the graph.
- Line Chart:
data-divchart="line" - Bar Chart:
data-divchart="bar" - Pie Chart:
data-divchart="pie"
- Title:
data-divchart-title="My Chart" - Data:
data-divchart-data='[{"label": "A", "value": 10}, {"label": "B", "value": 20}]' - Colors:
data-divchart-colors='["#4CAF50", "#2196F3", "#FFC107"]'. Note: for graph types like bar and pie, you can pass in multiple colors as shown. This would reflect based on the index of the data piece. E.g. the first data point you pass intodivchart-datawould correlate with the first color in the array. - Type:
data-divchart="["line"]
- More graph types (scatter, radar, doughnut, stacked bar/line)
- More UI customizations (custom fonts, sizing, subtitles, animations)
- Ability to pass in y and x axis data through separate attributes (easier data manipulation)
MIT