
A pure python module for scientific visualization, analysis and animation of 3D objects
and point clouds based on VTK and numpy.
Use pip to install:
pip install vtkplotterAutomatically generated documentation can be found here.
Intuitive and straightforward API which can be combined with VTK seamlessly in a program, whilst mantaining access to the full range of VTK native classes.
It includes a large set of working examples for all the following functionalities:
- Import meshes from VTK format, STL, Wavefront OBJ, 3DS, XML, Neutral, GMSH, OFF, PCD (PointCloud), volumetric TIFF stacks, DICOM, SLC, MHD, 2D images PNG, JPEG.
- Export meshes as ASCII or binary to VTK, STL, OBJ, PLY formats.
- Mesh analysis through the built-in methods of VTK package. Additional analysis tools like Moving Least Squares, mesh morphing.
- Tools to visualize and edit meshes (cutting a mesh with another mesh, slicing, normalizing, moving vertex positions, etc..). Interactive cutter widget.
- Split mesh based on surface connectivity. Extract the largest connected area.
- Calculate mass properties, like area, volume, center of mass, average size etc.
- Calculate vertex and face normals, curvatures, feature edges. Fill mesh holes.
- Subdivide faces of a mesh, increasing the number of vertex points. Mesh simplification.
- Coloring and thresholding of meshes based on associated scalar or vectorial data.
- Point-surface operations: find nearest points, determine if a point lies inside or outside a mesh.
- Create primitive objects like: spheres, arrows, cubes, torus, ellipsoids...
- Generate glyphs (associating a mesh to each vertex of a source mesh).
- Create animations easily by just defining the position of the displayed objects in the 3D scene. Add trailing lines and shadows to moving objects is also supported.
- Straightforward support for multiple sync-ed or independent renderers in the same window.
- Registration (alignment) of meshes with different techniques.
- Mesh smoothing with Laplacian and WindowedSinc algorithms.
- Delaunay triangulation in 2D and 3D.
- Generate meshes by joining nearby lines in space.
- Find the closest path from one point to another, travelling along the edges of a mesh.
- Find the intersection of a mesh with a line (or with another mesh).
- Analysis of Point Clouds:
- Moving Least Squares smoothing of 2D, 3D and 4D clouds
- Fit lines, planes and spheres in space
- Perform PCA (Principal Component Analysis) on point coordinates
- Identify outliers in a distribution of points
- Decimate a cloud to a uniform distribution.
- Basic histogramming and function plotting in 1D and 2D.
- Interpolate scalar and vectorial fields with Radial Basis Functions and Thin Plate Splines.
- Analysis of volumetric datasets:
- Isosurfacing of volumes
- Direct maximum projection rendering
- Generate volumetric signed-distance data from an input surface mesh
- Probe a volume with lines and planes
- Generate stream-lines and stream-tubes from vectorial fields
- Add sliders and buttons to interact with the scene and the individual objects.
- Draw
latex-formatted formulas on the rending window. - Examples using SHTools package for spherical harmonics expansion of a mesh shape.
- Integration with the Qt5 framework.
- Support for FEniCS/Dolfin platform for visualization of finite-element calculations.
- Export a 3D scene and embed it into a web page.
vtkplotter mesh.obj
# valid formats: [vtk,vtu,vts,vtp,vtm,ply,obj,stl,3ds,xml,neutral,
#                 gmsh,pcd,xyz,txt,byu,tif,off,slc,vti,mhd,dcm,png,jpg]
to visualize multiple files or files time-sequences try -n or -s options. Use -h for help.
Voxel-data (mhd, vti, slc, tiff) files can also be visualized with options -g, --slicer,
or --lego e.g.:
|
 |
 |
 |
|---|
vtkplotter            examples/data/head.vti    #1 use a slider to control isosurfacing
vtkplotter -g -c blue examples/data/embryo.slc  #2 (3D scan of a mouse embryo)
vtkplotter --slicer   examples/data/embryo.slc  #3 can be used to read DICOM datasets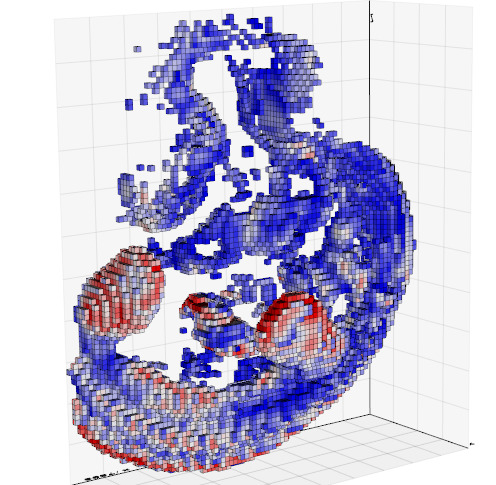
vtkplotter --lego examples/data/embryo.tif #4 visualize colorized voxelsA get-started tutorial script is available for download:
git clone https://github.com/marcomusy/vtkplotter.git
cd vtkplotter/examples
python tutorial.py
More than 180 working examples can be found in directories (scroll down to see the screenshots):
examples/basic
examples/advanced
examples/volumetric
examples/simulations
examples/other
examples/other/dolfin.
 |
Apply a Moving Least Squares algorithm to obtain a smooth surface from a to a large cloud of scattered points in space (script) python advanced/moving_least_squares2D.py |
|
Create a 3D animation in exactly 10 lines of code. (script) Trails and shadows can be added to moving objects easily. python simulations/airplanes.py |

|
Simulation of a gyroscope hanging from a spring (script) python simulations/gyroscope1.py |

|
Quantum-tunnelling effect integrating the Schroedinger equation with 4th order Runge-Kutta method. The animation shows the evolution of a particle in a box hitting a sinusoidal potential barrier. (script) python simulations/tunnelling2.py |
|
Visualizing a Turing system of reaction-diffusion between two molecules1 (script) python simulations/turing.py |
|
Support for the FEniCS/dolfin platform for visualization of PDE and finite element solutions (see here). 
|
Scientific publications using vtkplotter so far:
- X. Diego et al.: "Key features of Turing systems are determined purely by network topology", Physical Review X, 20 June 2018.
- M. Musy, K. Flaherty et al.: "A Quantitative Method for Staging Mouse Limb Embryos based on Limb Morphometry", Development, 5 April 2018, doi: 10.1242/dev.154856.
- G. Dalmasso et al., "Evolution in space and time of 3D volumetric images", in preparation.
Have you found this software useful for your research? Please cite it as:
M. Musy et al.
"vtkplotter, a python module for scientific visualization and analysis of 3D objects
and point clouds based on VTK (Visualization Toolkit)",
Zenodo, 10 February 2019, doi: 10.5281/zenodo.2561402.