4. Blockers
Please note: the Blockers page only works if you either 'tag' work items as Blocked, OR if you used the 'Blocked' (yes/no) field in an inherited process template. If you use both these approaches it will double count the numbers. It is not able to calculate if child-tasks for a work item are blocked and how much time is lost there.
The Blockers page provides insights for work items at Backlog level (PBI, User Story, Bug, etc.). It excludes any levels higher such as Epic or Feature. Task work item type is not included in the dataset.
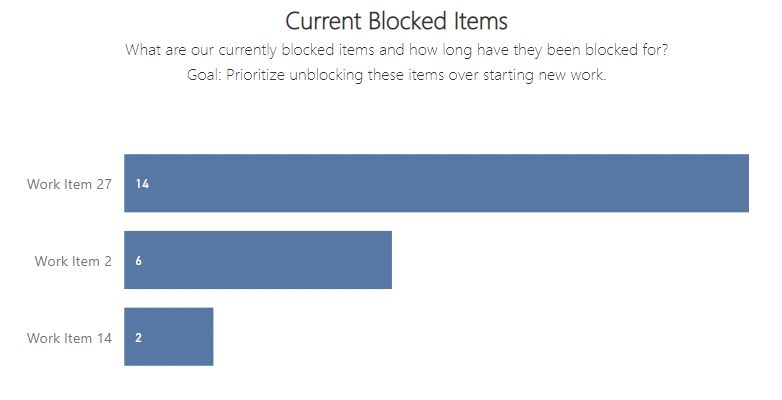
This chart shows the items that are currently identified as blocked and how long (in calendar days) since they were last updated.
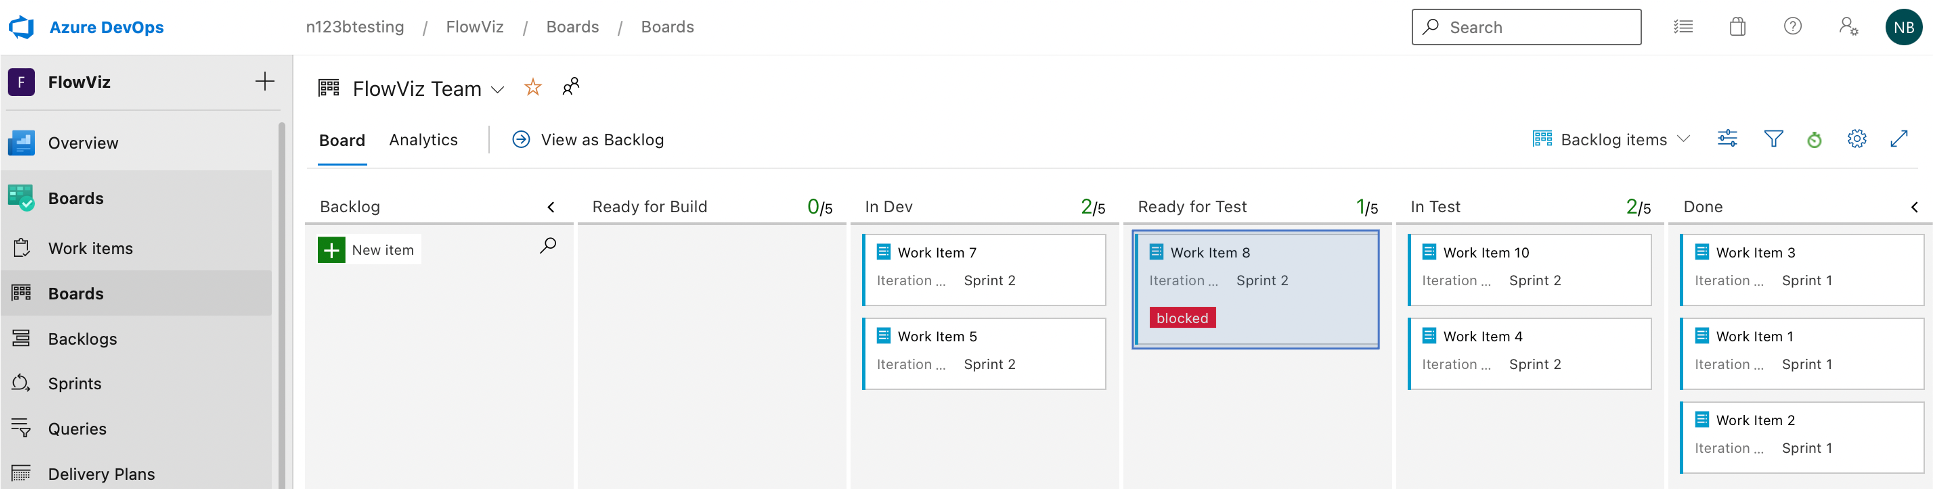
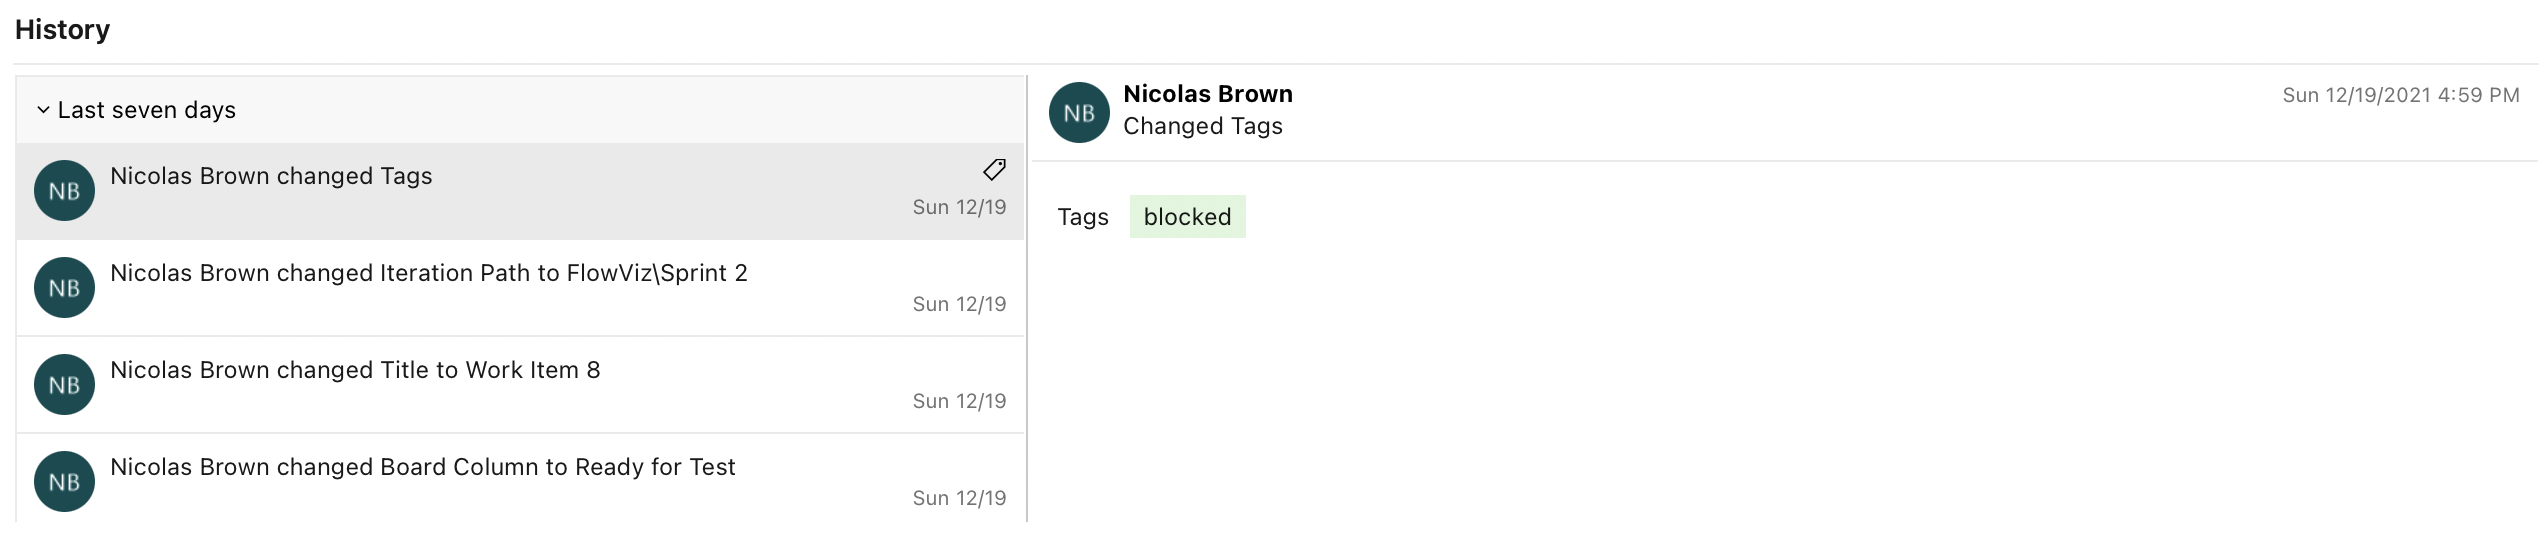
In this example, work item 8 is currently ‘blocked’ – The Current Blocked Items chart would highlight how long it has had the blocked tag for.
The intention is to focus on unblocking these items over starting new work. Potentially using this chart as an input into a daily scrum/standup.
When overdriven, it can lead to work being unblocked quickly, however it does not guarantee work will be ‘flowing’ through the rest of your process, usually you can spot this by seeing low Throughput or high Cycle Time.
It can be gamed by ‘forgetting’ to identify items as blocked when they are blocked, using alternative means of blocking work (e.g. a blocked column) or by removing then re-adding the block identifier to an item, thus ‘resetting’ the timestamp for when it was blocked.
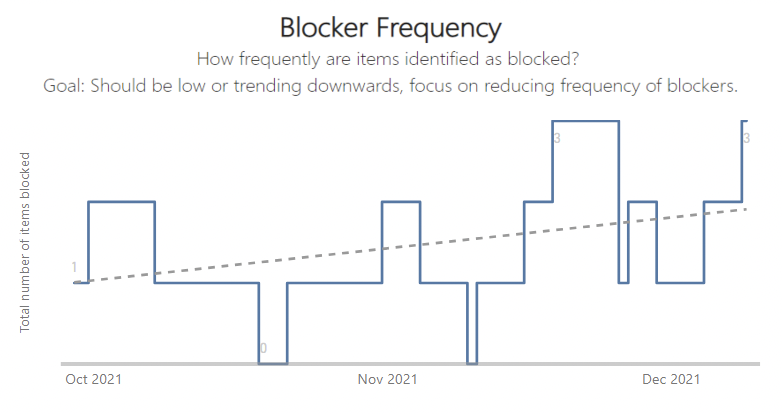
This chart counts any time an issue is identified as ‘blocked’ each day. A supporting trend line shows the direction of frequency of work being marked as blocked.
Every time an item is identified as 'Blocked' it counts as 1 towards that count.
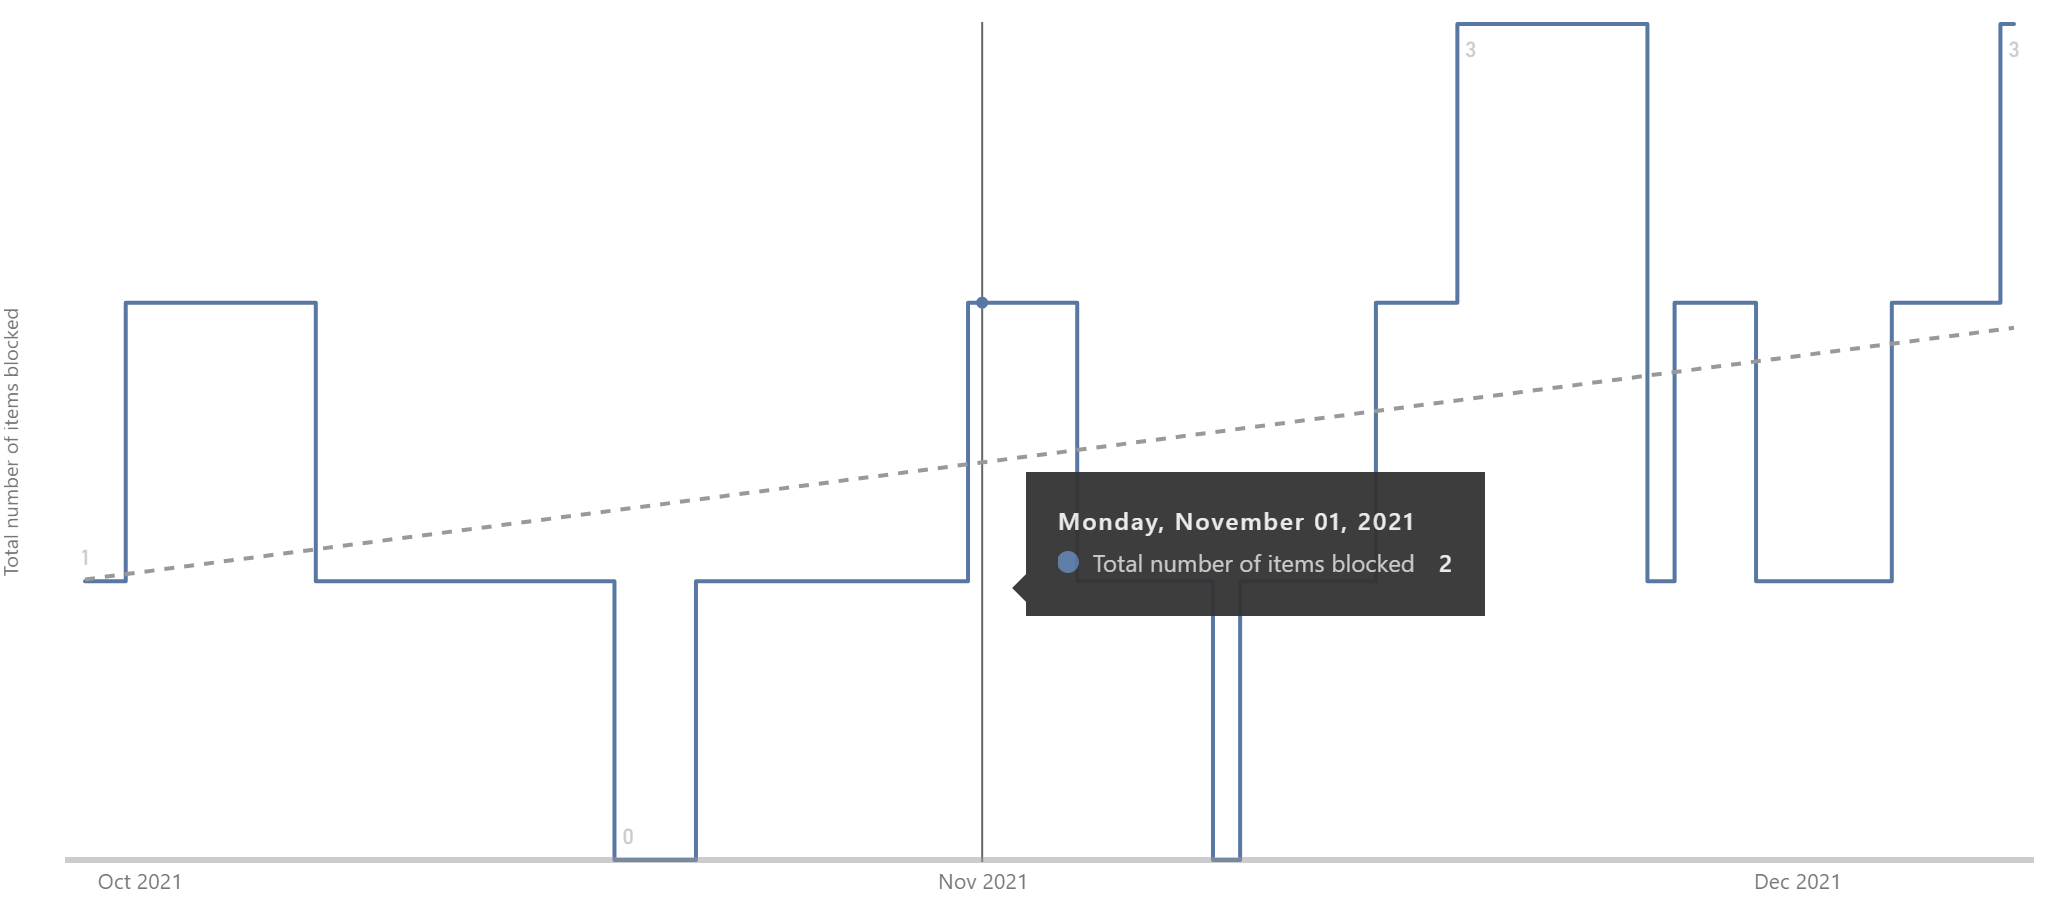
The intention is to look at the trend, as well as the frequency of work being blocked. It should be trending downwards/low. If it’s high then focus on reducing dependencies, potentially using this chart as an input into a Retrospective.
When overdriven, it can lead to work being unblocked quickly, however it does not guarantee work will be ‘flowing’ through the rest of your process, usually you can spot this by seeing low Throughput or high Cycle Time.
It can be gamed by ‘forgetting’ to identify items as blocked when they are blocked, using alternative means of blocking work (e.g. a blocked column).
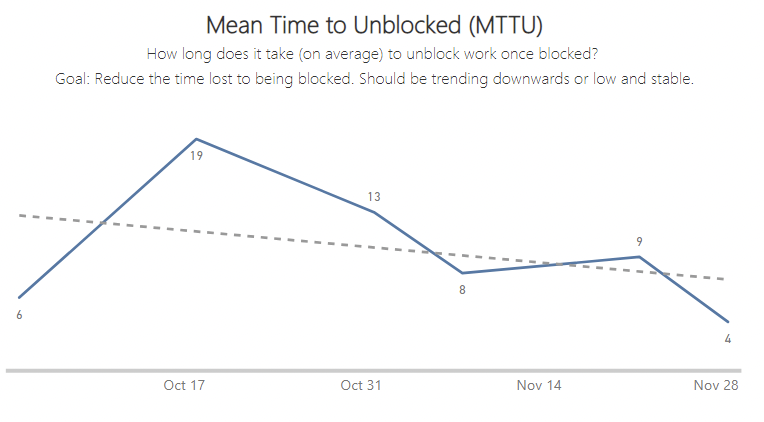
This chart shows for items that are unblocked on a given week, how long (on average) did it take to unblock those items, as well as a trend line to show if this is decreasing (improving) over time.
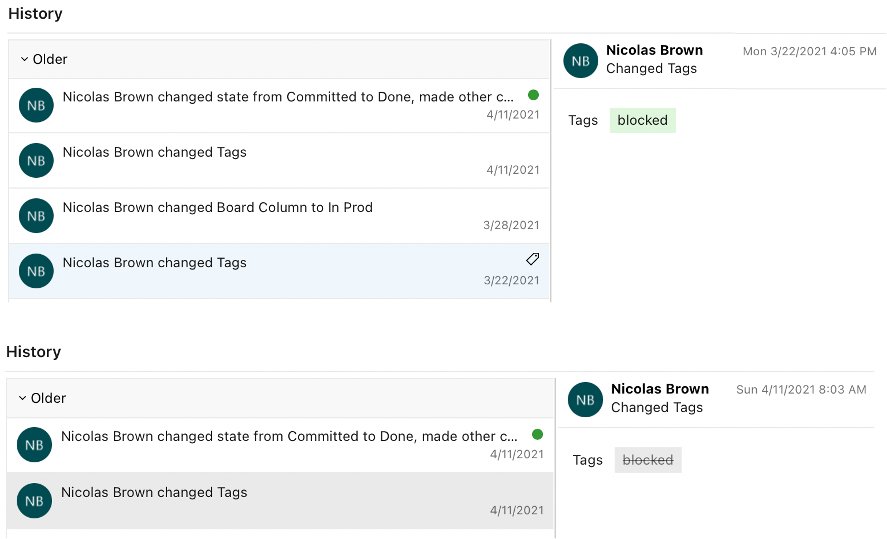
We first need the difference in timestamps of when an item is ‘unblocked’ after being ‘blocked’. In this example we can see this item was ‘Blocked’ on 22nd March 2021 and ‘Unblocked’ on 4th April 2021, giving it a time of 20 days to ‘unblock’.
MTTU takes the average for items that are ‘unblocked’ in a given week, so if we had:
- Item 1 – Unblocked w/c 13th Dec – time to unblock 7 days
- Item 2 – Unblocked w/c 13th Dec – time to unblock 3 days
- Then the MTTU for w/c 13th Dec would be: (7 days + 3 days) / 2 items = 5 days
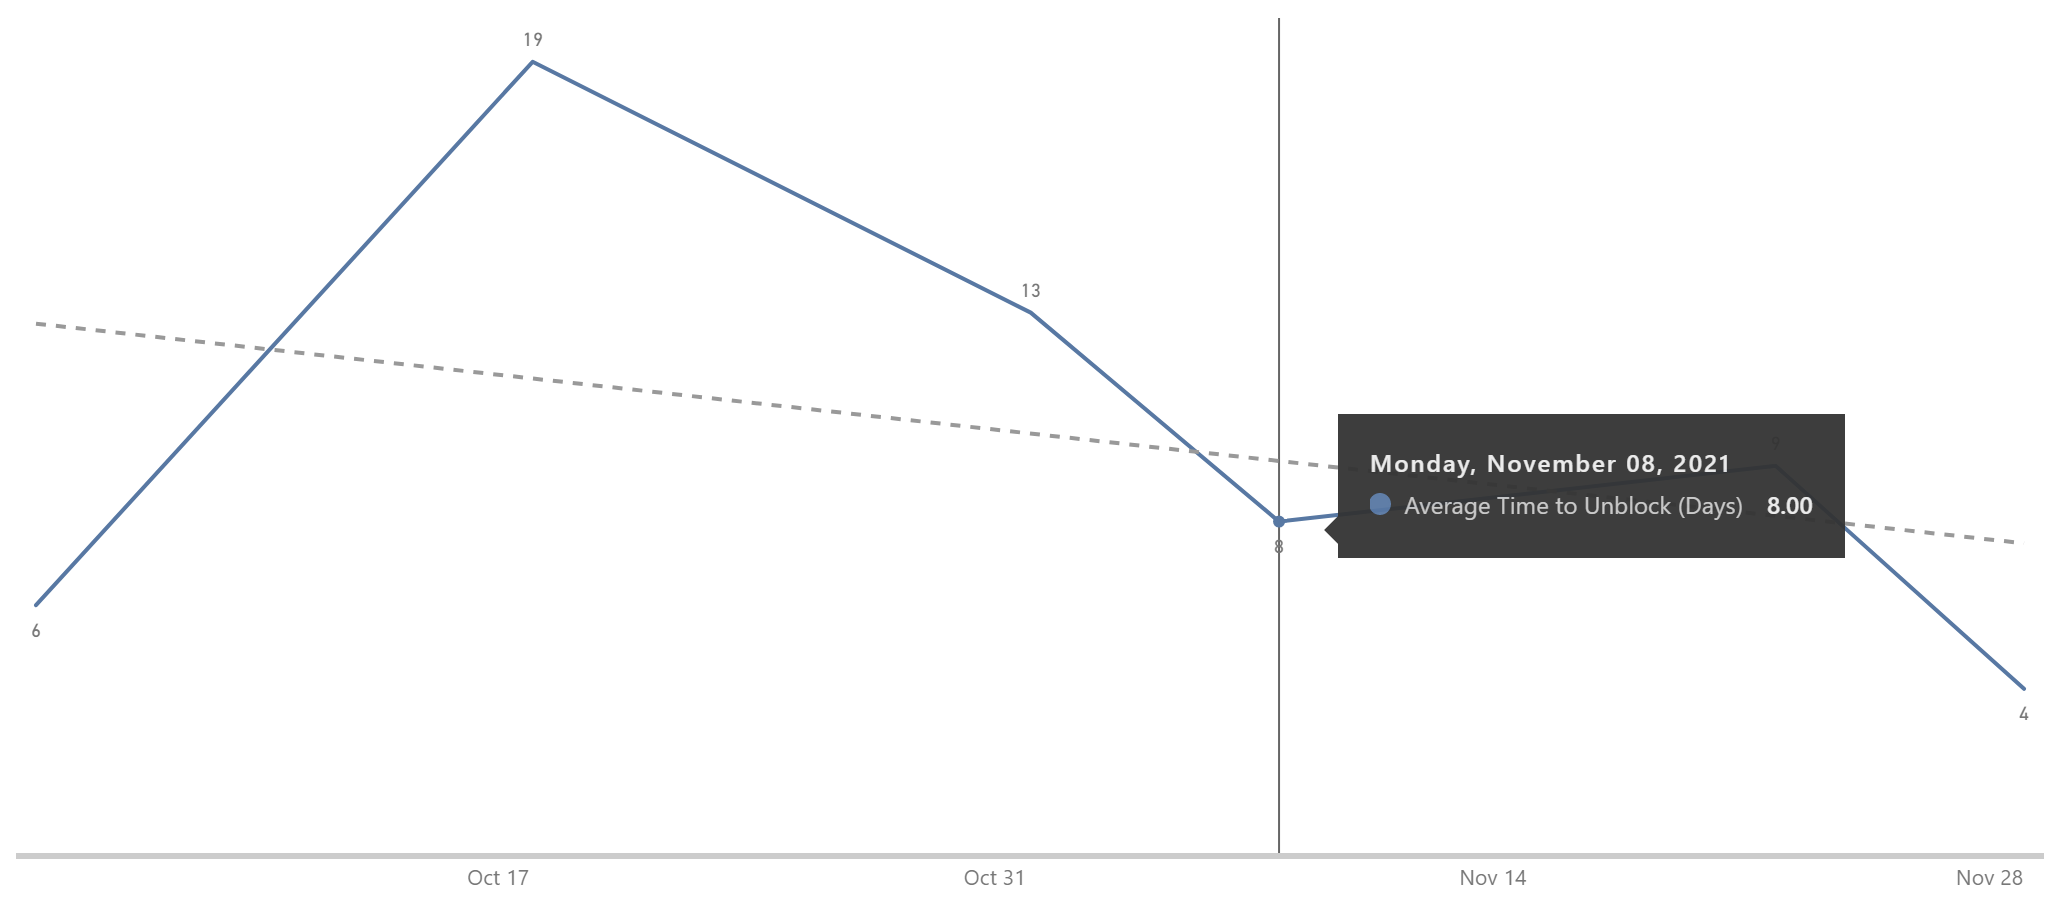
The intention is to use this chart to see how long it takes blockers to be resolved, as well as if this time to resolve is improving (trend line heading downward) or getting worse (trend line going upward) over time.
When overdriven, it can lead to work being unblocked quickly, however it does not guarantee work will be ‘flowing’ through the rest of your process, usually you can spot this by seeing low Throughput or high Cycle Time. Similarly teams may focus on items not blocked for very long (low hanging fruit) rather than items that have been blocked for a long time.
It can be gamed by ‘forgetting’ to identify items as blocked when they are blocked, using alternative means of blocking work (e.g. a blocked column), or by removing then re-adding the block identifier to an item, thus ‘resetting’ the timestamp (or keeping the days to unblocked low) for when it was blocked.
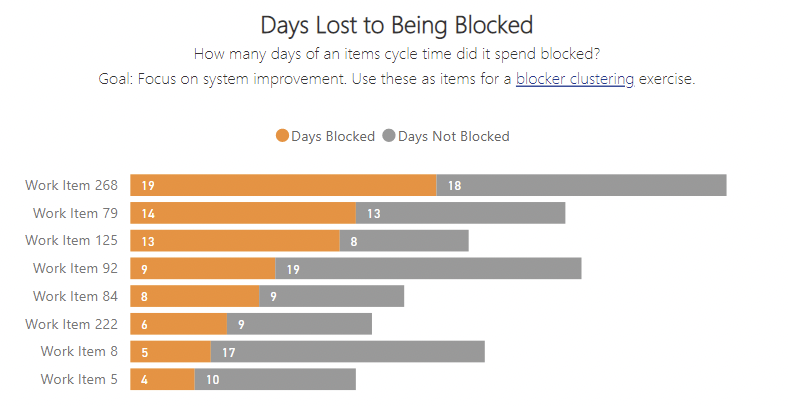
This chart shows how many days of an items total cycle time were spent being blocked (in orange) versus not being blocked (in grey) The calculation is pretty simple:
- Total cycle time – time blocked = time not blocked
- Total cycle time – time not blocked = time blocked
Identify how much time is being lost due to work being blocked, potentially identifying themes around why items are blocked. Use this chart as an input to a blocker clustering exercise.
When overdriven, it can lead to low time lost to being blocked, however it does not guarantee work will be ‘flowing’ through the rest of your process, usually you can spot this by seeing high Cycle Time (large grey bars).
It can be gamed by ‘forgetting’ to identify items as blocked when they are blocked, using alternative means of blocking work (e.g. a blocked column) or by removing then re-adding the block identifier to an item, thus ‘resetting’ the timestamp (or keeping the days to unblocked low) for when it was blocked.