A react app for visualizing sine signals
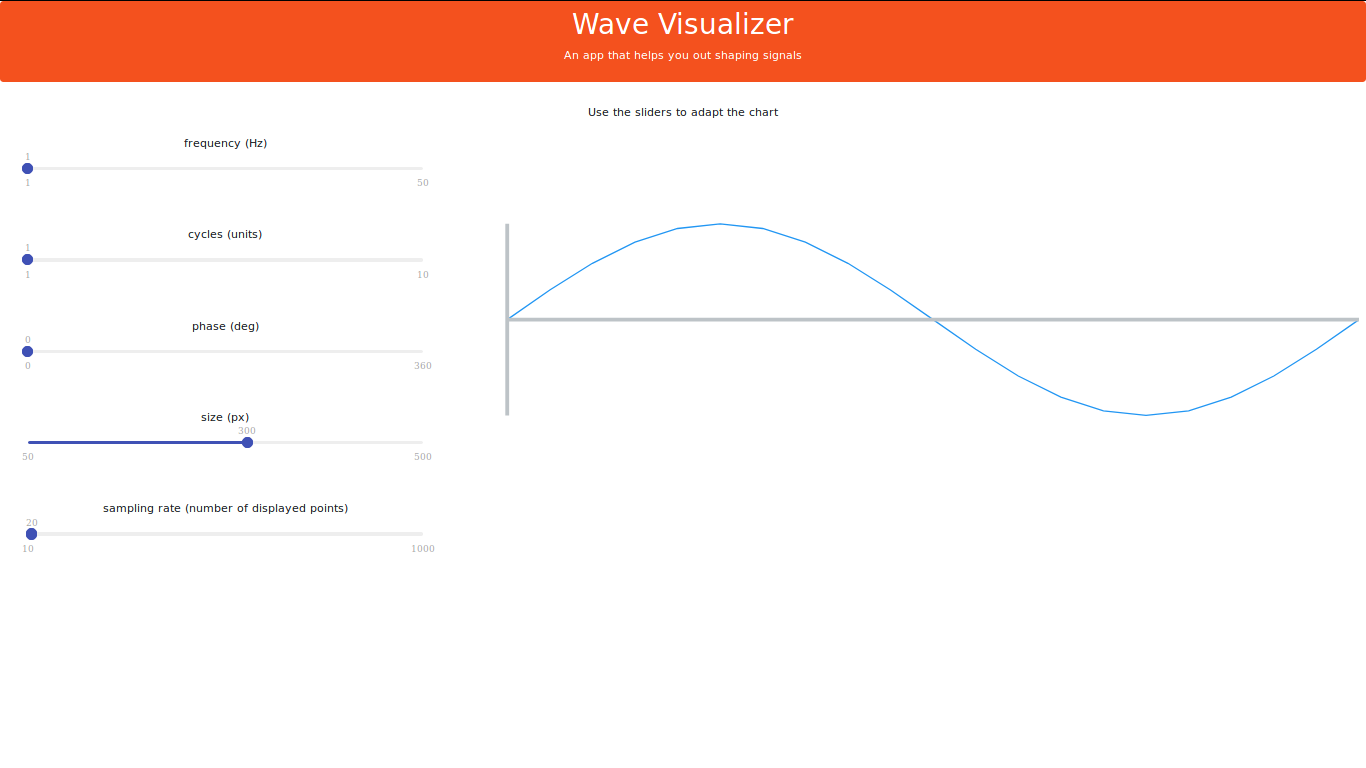
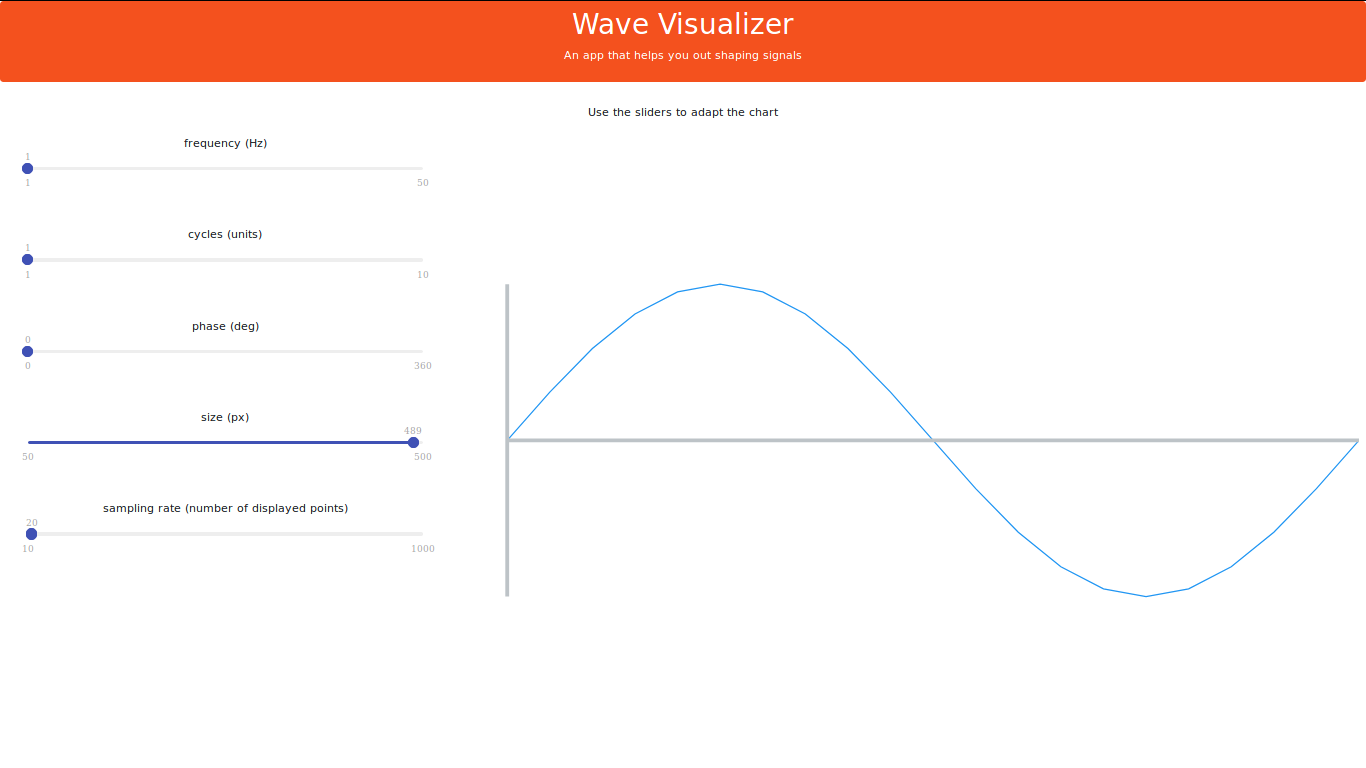
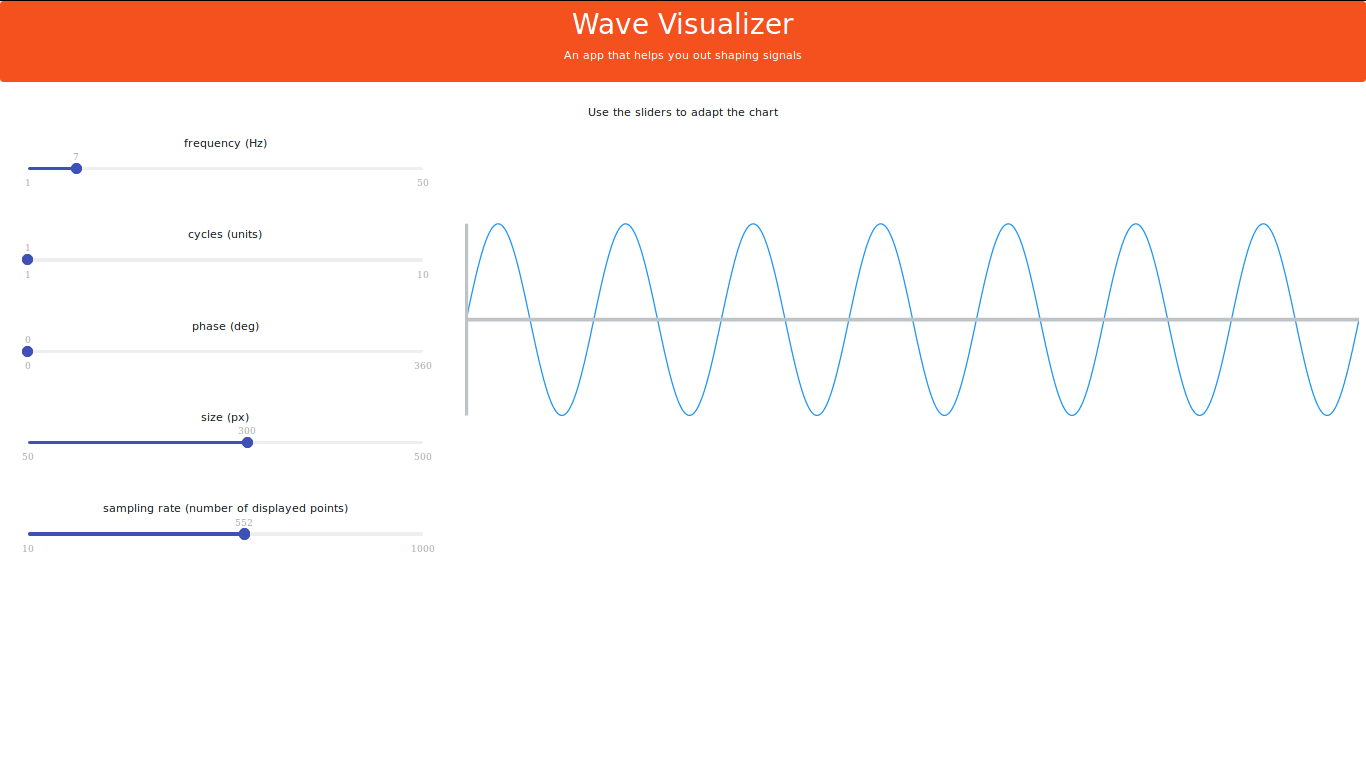
This app uses React and Bootstrap to render a sine function under the effect of the following modifiable parameters:
-Frequency (in Hz)
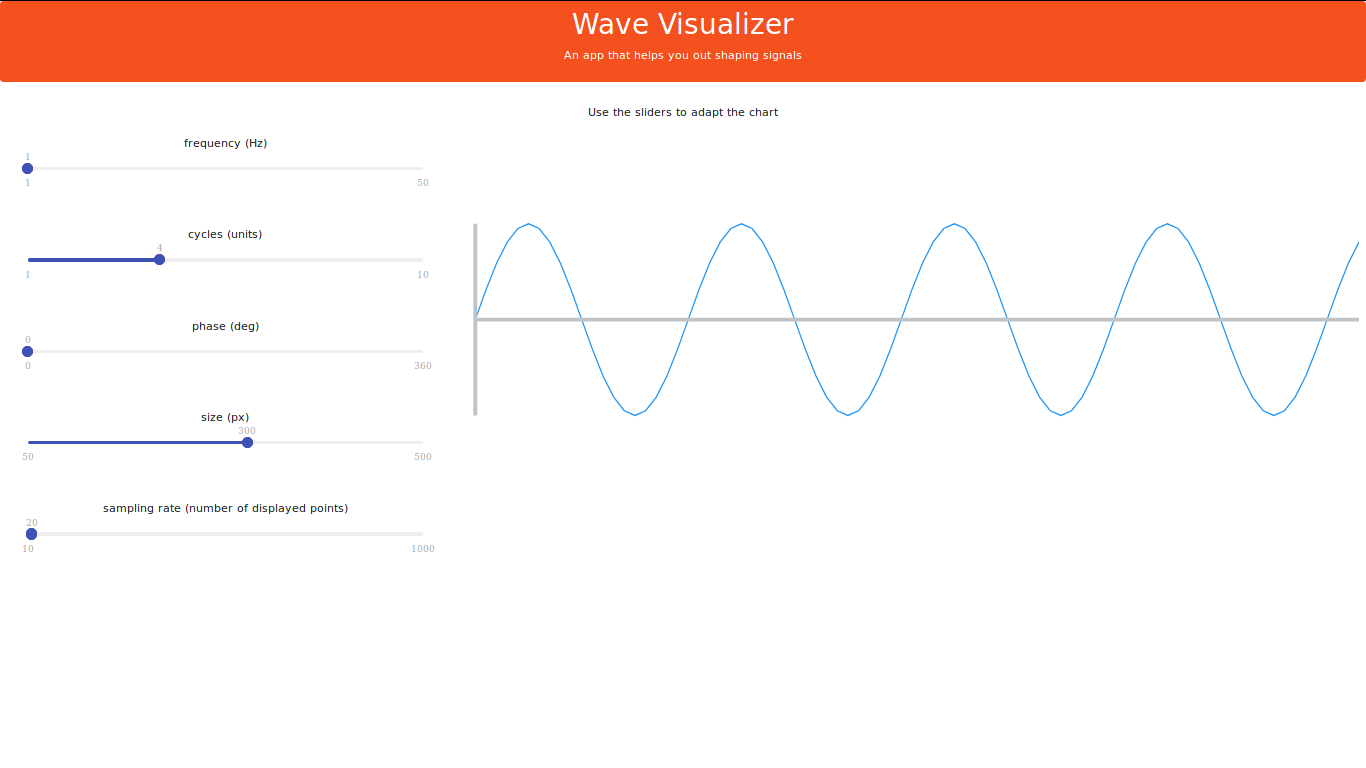
-Number of cycles to present
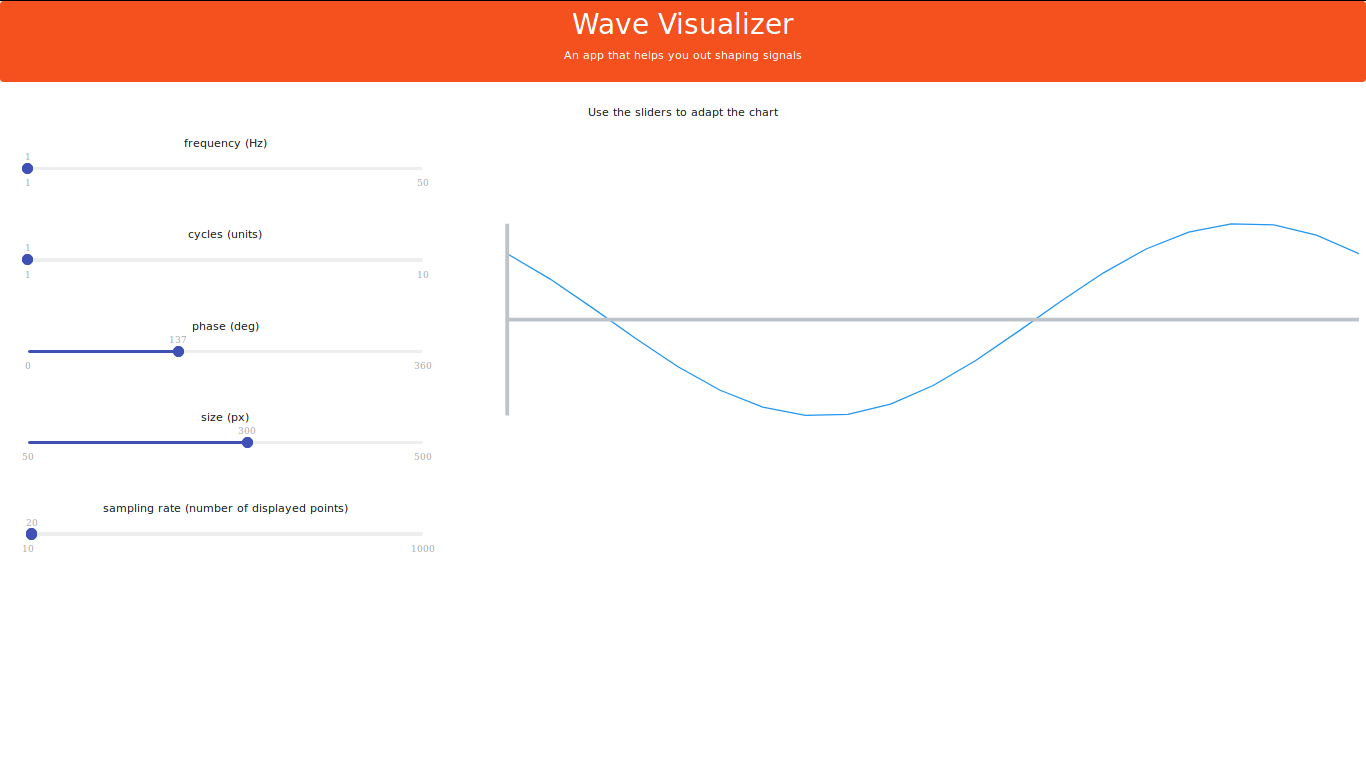
-Phase (in degrees)
Besides, it enables the user to enhance the render by means of an scalable plot (in Y axis) and a modifiable resolution per cycle (sampling rate).
In order to inspect it, clone the repository in your computer, then, in the project directory /wavevisualizer, you can run:
then
This runs the app in the development mode.
Open http://localhost:3000 to view it in the browser.
The page will reload if you make edits.
You will also see any lint errors in the console.
If otherwise you are only interested in the bundle, go to the /wavevisualizer/build folder and get it from there.
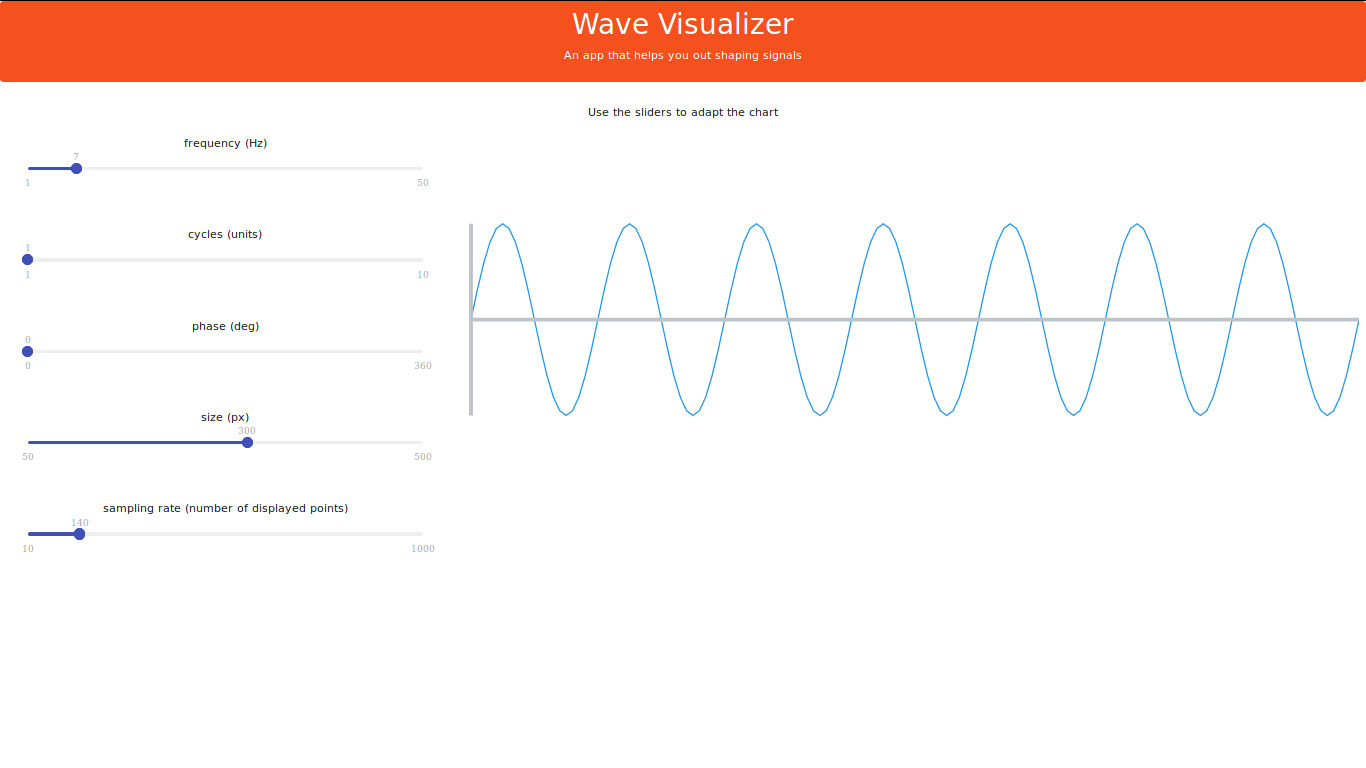
By default, for every one Hz the resolution sets automatically to 20 points. However, the user can easily adapt the chart to display up to 1000 points. Just drag the slider to the desired level.
A simple unit test is included in App.test.js. If you would like to implement your own unit tests and run them just execute:
This app uses Bootstrap for managing responsiveness, react-input-range for the input sliders and the default react components installed with create-react-app.
Many thanks to all for making the code available. Also thanks to Brandon Morelli's excellent SVG introductory tutorial: https://codeburst.io/simple-data-visualization-with-react-js-svg-line-chart-tutorial-df12e5843ce