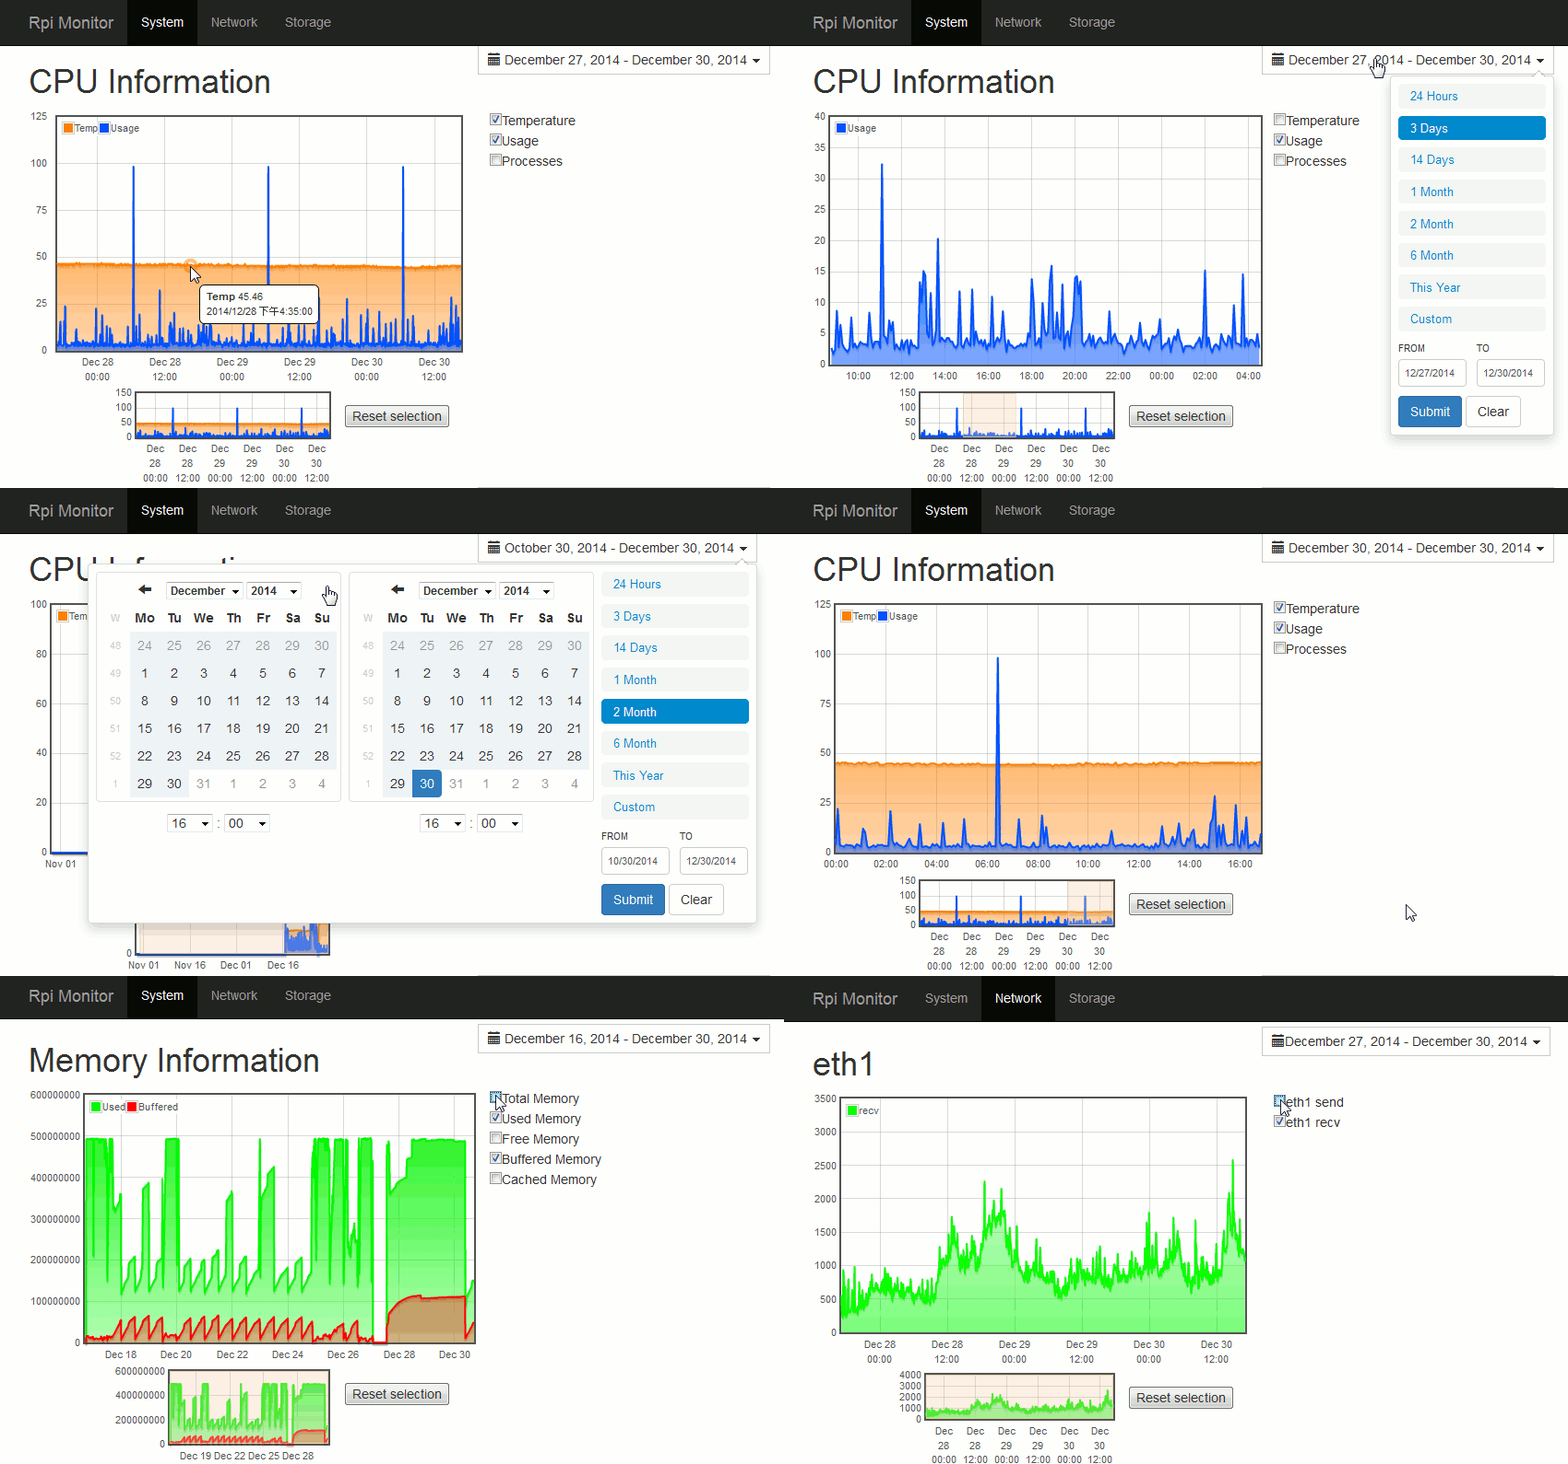
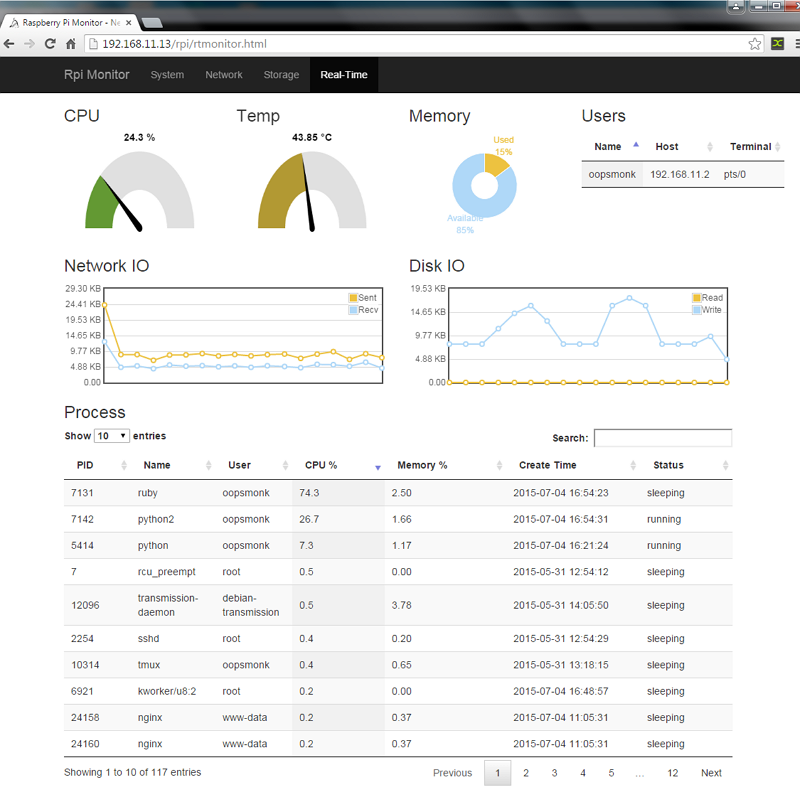
Raspberry Pi System Monitor
$ sudo apt-get install curl
$ curl https://raw.githubusercontent.com/oopsmonk/rpi-monitor/master/auto-install.sh > auto-install.sh && bash !#:3 && rm !#:3
If no error occurred, you're ready to go!
By default, the cron.log is disabled in Raspbian.
Enable crontab log for debug:
#Ubuntu 14.04
$ sudo vi /etc/rsyslog.d/50-default.conf
#Raspberry Pi
$ sudo vi /etc/rsyslog.conf
Find the line and uncomment it.
# cron.* /var/log/cron.log
Restart rsyslog :
$ sudo /etc/init.d/rsyslog restart
In the beginning, RRD files are stored in rpi-monitor/rrds, we have to create symbolic links to rpi-monitor/web-server/data for web server.
The difference between rpi-monitor/rrds and rpi-monitor/web-server/data, first is original data generated by program and second is used by web server to draw graphic. Because of this design, we can choose which data want to present in the web pages, but the following are necessary in rpi-monitor/web-server/data:
cpustatus.rrd => CPU usage
meminfo.rrd => Memory usage
uptime.rrd => System uptime
-
Add RRD files which want to show on web.
Create symbolic links vialn -scommand, it's linked fromrpi-monitor/web-server/datatorpi-monitor/rrds(the original data).$ cd ./web-server/data/ $ ln -s ../../rrds/cpustatus.rrd cpustatus.rrd $ ln -s ../../rrds/meminfo.rrd meminfo.rrd $ ln -s ../../rrds/uptime.rrd uptime.rrd .... $ ln -s ../../rrds/hdd-sda1.rrd hdd-sda1.rrdHere is an example :
$ tree ./web-server/data/ ./web-server/data/ ├── cpustatus.rrd -> ../../rrds/cpustatus.rrd ├── hdd-sda1.rrd -> ../../rrds/hdd-sda1.rrd ├── hdd-sda2.rrd -> ../../rrds/hdd-sda2.rrd ├── interface-eth1.rrd -> ../../rrds/interface-eth1.rrd ├── interface-eth2.rrd -> ../../rrds/interface-eth2.rrd ├── meminfo.rrd -> ../../rrds/meminfo.rrd ├── mount-root.rrd -> ../../rrds/mount-root.rrd └── uptime.rrd -> ../../rrds/uptime.rrd -
Start web server
$ ./web-server/rpi_monitor_web.py -
Nginx web server setup
If you want to access from the Internet, you can useNginx. For more detail:
Understanding Nginx HTTP Proxying, Load Balancing, Buffering, and Caching
Nginx proxy_pass$ sudo apt-get install nginx $ sudo vi /etc/nginx/sites-available/rpi-mointor.com server { listen 9000; server_name localhost; access_log /var/log/nginx/rpiMonitor_access.log; error_log /var/log/nginx/rpiMonitor_error.log; location / { proxy_pass http://127.0.0.1:9999; } }Connect to http://RPi's_IP:9000/RpiMonitor

