


A Python Package for Visualizing and Analyzing Hyperspectral Data in Coastal Environments
- Free software: MIT License
- Documentation: https://hypercoast.org
HyperCoast is a Python package designed to provide an accessible and comprehensive set of tools for visualizing and analyzing hyperspectral data in coastal environments. Hyperspectral data refers to the information collected by sensors that capture light across a wide range of wavelengths, beyond what the human eye can see. This data allows scientists to detect and analyze various materials and conditions on the Earth's surface with great detail. Unlike multispectral data, which captures light in a limited number of broad wavelength bands (typically 3 to 10), hyperspectral data captures light in many narrow, contiguous wavelength bands, often numbering in the hundreds. This provides much more detailed spectral information. Leveraging the capabilities of popular packages like Leafmap and PyVista, HyperCoast streamlines the exploration and interpretation of complex hyperspectral remote sensing data from existing spaceborne and airborne missions. It is also poised to support future hyperspectral missions, such as NASA's SBG and GLIMR. It enables researchers and environmental managers to gain deeper insights into the dynamic processes occurring in aquatic environments.
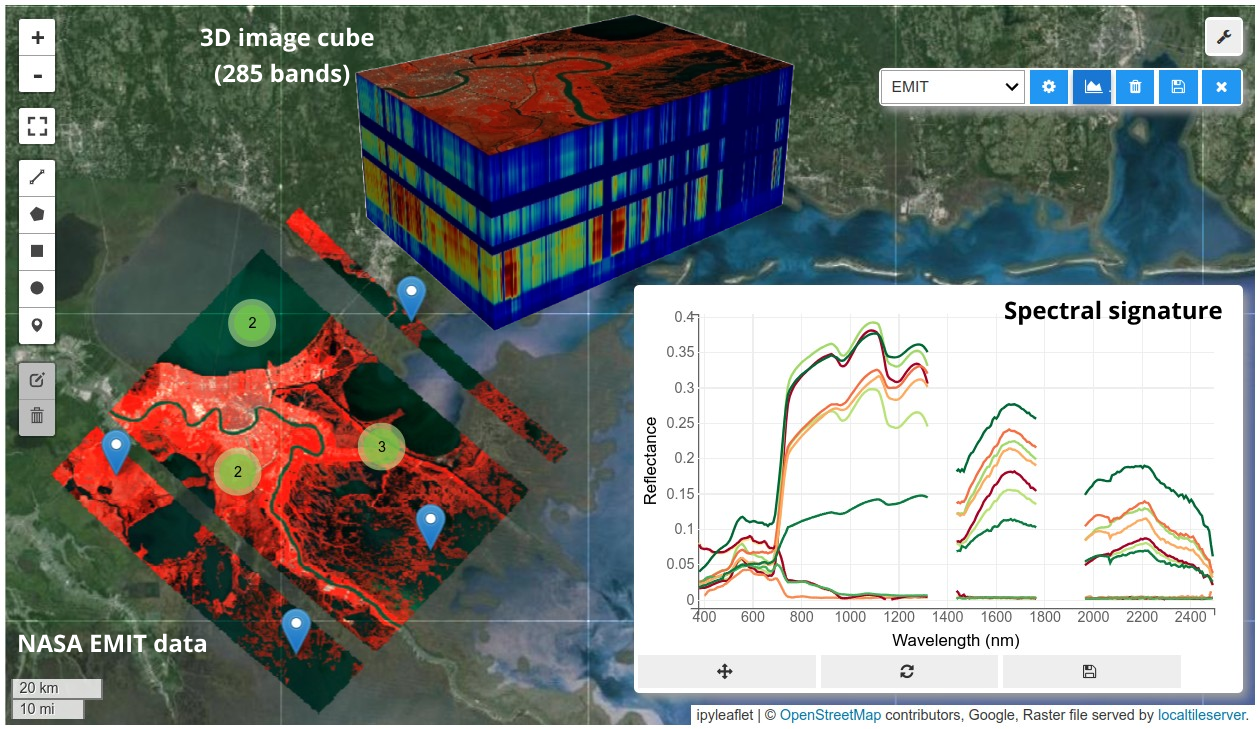
HyperCoast supports the reading and visualization of hyperspectral data from various missions, including AVIRIS, NEON, PACE, EMIT, and DESIS, along with other datasets like ECOSTRESS. Users can interactively explore hyperspectral data, extract spectral signatures, change band combinations and colormaps, visualize data in 3D, and perform interactive slicing and thresholding operations (see Figure 1). Additionally, by leveraging the earthaccess package, HyperCoast provides tools for interactively searching NASA's hyperspectral data. This makes HyperCoast a versatile and powerful tool for working with hyperspectral data globally, with a particular focus on coastal regions.
If you find HyperCoast useful in your research, please consider citing the following papers to support us. Thank you!
- Liu, B., & Wu, Q. (2024). HyperCoast: A Python Package for Visualizing and Analyzing Hyperspectral Data in Coastal Environments. Journal of Open Source Software, 9(100), 7025. https://doi.org/10.21105/joss.07025.
- Searching for NASA hyperspectral data interactively
- Performing atmospheric correction using Acolite
- Interactive visualization and analysis of hyperspectral data, such as AVIRIS, DESIS, EMIT, PACE, NEON AOP
- Interactive visualization of NASA ECOSTRESS data
- Interactive visualization of PACE chlorophyll-a data
- Interactive extraction and visualization of spectral signatures
- Changing band combinations and colormaps interactively
- Visualizing hyperspectral data in 3D
- Visualizing ERA5 temperature data in 3D
- Interactive slicing and thresholding of hyperspectral data in 3D
- Saving spectral signatures as CSV files
- Visualizing hyperspectral data in 3D (notebook)

- Interactive slicing of hyperspectral data in 3D (notebook)

- Interactive thresholding of hyperspectral data in 3D (notebook)

- Visualizing ERA5 temperature data in 3D (notebook)

- Changing band combinations and colormaps interactively (notebook)


The HyperCoast project draws inspiration from the nasa/EMIT-Data-Resources repository. Credits to the original authors. We also acknowledge the NASA EMIT program support through grant no. 80NSSC24K0865.
HyperCoast is released under the MIT License. However, some of the modules in HyperCoast adapt code from other open-source projects, which may have different licenses. Please refer to the license notice in each module for more information. Credits to the original authors.
- emit.py: Part of the code is adapted from the nasa/EMIT-Data-Resources repository, which is released under the Apache License 2.0.
- aviris.py: Part of the code is adapted from the jjmcnelis/aviris-ng-notebooks, which is released under the MIT License.
 Bingqing Liu 💻 🎨 🤔 |
 Qiusheng Wu 💻 🎨 🚧 |
 Alex Leith 💻 👀 |
 arfy slowy 💻 🚧 |
 Guillermo E. Ponce-Campos 💻 🐛 |
 Carsten Lemmen 👀 |