This interactive website was created by Benjamin Storck within the course "Data Ethics & Open Data" (lecturer Lukas Rohatsch,MSc) in winter semester 22/23 at the UAS (FH Technikum Wien).
Note: The website was never published, since the online rental housing platform did not agree/answer to the publication of the data.
Therefore, the URL was removed from scraping.py.
For the scraping, python and the modules json,urllib.request and bs4 need to installed (e.g. via pip install). Some starting files and empty folders need to added, but had to be removed (see note above). The website only needs JavaScript and an internet connection and is run in VS Code with Live Server (no CORS implementation).
The high prices per square meter in the private housing sector put low-income households under severe financial pressure, especially in European capitals. Open Data from the City of Vienna and the Austrian Open Data platform, as well as scraped data by online rental housing platforms are used to analyse the current housing situation in Vienna. An interactive visualization is provided to illustrate the issue, particularly with respect to low-income households.
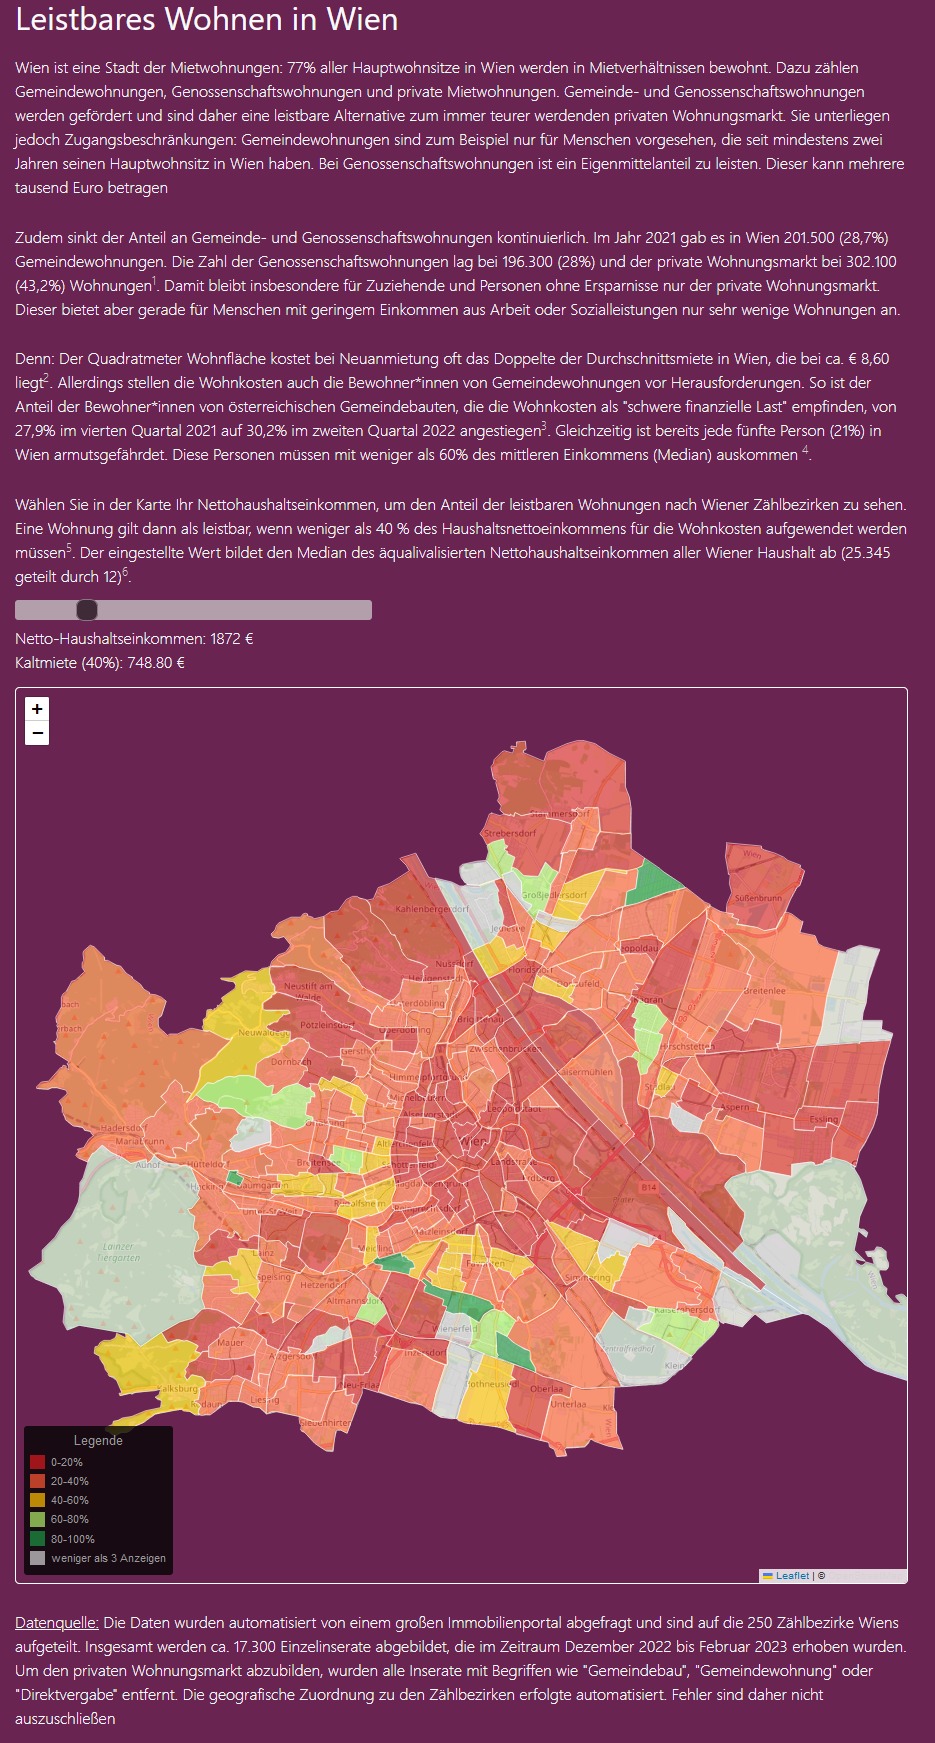
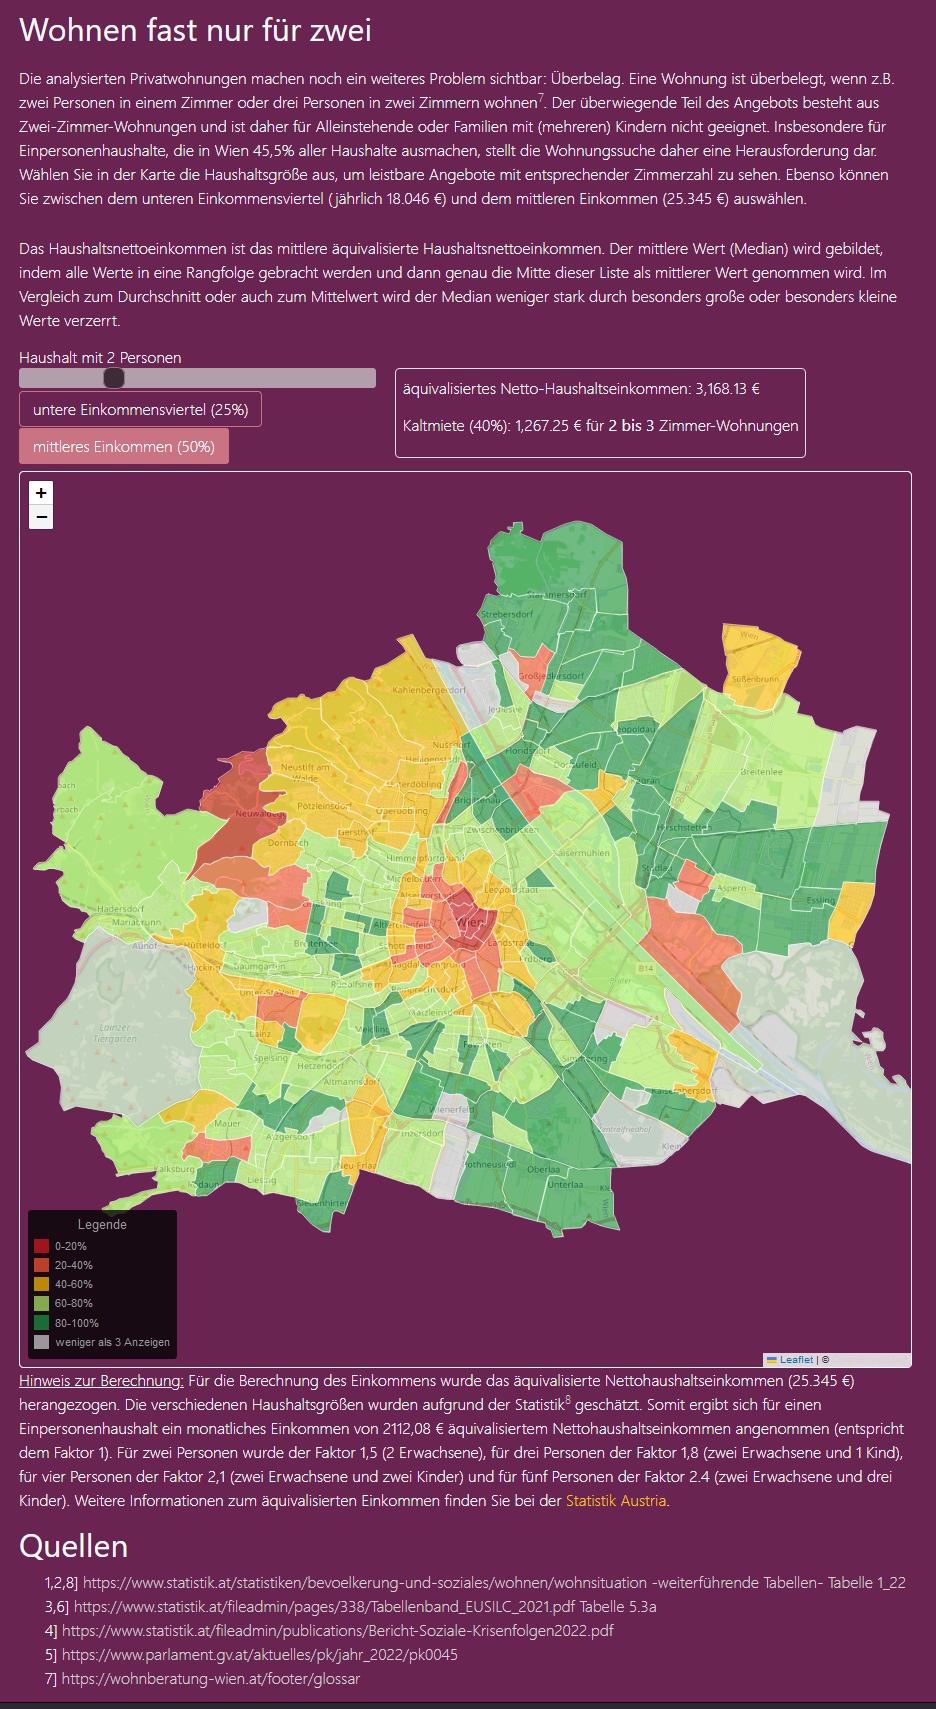
The data was retrieved via a python script using the module “Beautiful Soup on four different dates from an Austrian rental housing platform. The acquired data was cleaned for missing values and entries containing words suggesting subsidized housing (like “Gemeindebau”, “Direktvergabe” etc.) were removed to ensure a limitation to the private housing sector. The data was used to implement two maps: one with a interactive slider where the user can input their respective net household income and the map would display how many ads in one of the 250 Zählbezirke are affordable. The other map focuses on people who are just moving to Vienna and don’t suffice the requirements for a Wiener Wohnen, which is the entry barrier for subsidized housing. This makes them heavily dependent on the private sector [1].
The first map displays affordable housing ads with a colour legend referring varying degree of availability. The slider with the income is interactive and automatically calculates 40% of the net household income as basis for affordable ads.
The second map was based on the “äquivalisiertes” net house hold income (a detailed description can be found below the second map) and the “Überbelag” definition of Wiener Wohnen. The user can use a slider to choose a household size between 1-5 persons and the map displays the available ads with a variable number of rooms set which was sufficient to fail the “Überbelag” criteria. Additionally, the user can choose between a net household income of the lower 25% or the median net household income (50%).
The proportion of household income spent on rent is an important factor in the wake of the sharp rise in inflation. Affordable rent is increasingly seen not only as a financial but also as a social and political issue, especially in European capitals like Paris, Berlin, or Madrid. Vienna has an extraordinary history of providing its citizens with affordable rental space, with 43% of tenants [2] live in some form of subsidized rental housing. However, access to subsidized housing is limited, making the private sector the only option. Capital cities tend to have a higher proportion of low-income groups. Thus 21% of the Viennese population are at risk of poverty or exclusion[2] vs 15% in Austria as a whole. This means that a single person household has less than 16.457 € per year (or 1,371 € per month) disposable income [3]. Low disposable household incomes combined with high average prices of the urban private housing sector result in an increased proportion of the income that has to be spent on covering the cost of rent. Most institutions regard 40% of the net household income spent on rent as ‘affordable’[4]. Despite the high proportion of subsidised housing, 11% of Vienna's population subjectively spend 40% or more of their household income on housing, 36% spend between 25-40% of their income on housing costs.
[1] https://www.wien.gv.at/spezial/integrationsmonitor2020/wohnen/rechtssicherheit-verteilung-der-bevoelkerung-ueber-die-segmente-des-wohnungsmarkts/, last retrieved 24.02.2023
[2] https://www.statistik.at/statistiken/bevoelkerung-und-soziales/wohnen/wohnsituation, last retrieved 19.02.2023.
[3] https://www.statistik.at/fileadmin/pages/338/Glossar_Tabband_Web.pdf, last retrieved 19.02.2023.

