This repository is the official repository of the paper:
Machine learning-based detection of cardiovascular disease using ECG signals: performance vs. complexity
Huy Pham, Konstantin Egorov, Alexey Kazakov, Semen Budennyy*
*Correspondence: [email protected]
Introduction:
Cardiovascular disease remains a significant problem in modern society. Among non-invasive techniques, the electrocardiogram (ECG) is one of the most reliable methods for detecting cardiac abnormalities. However, ECG interpretation requires expert knowledge and it is time-consuming. Developing a novel method to detect the disease early improves the quality and efficiency of medical care.
Methods:
The paper presents various modern approaches for classifying cardiac diseases from ECG recordings. The first approach suggests the Poincaré representation of ECG signal and deep-learning-based image classifiers. Additionally, the raw signals were processed with the one-dimensional convolutional model while the XGBoost model was facilitated to predict based on the time-series features.
Results:
- Poincaré-based methods excel in predicting atrial fibrillation (AF).
- 1D ResNet outperforms other models, achieving an F1 score of 82% (CinC 2017) and 71% (CinC 2020).
- Efficiency metrics, including power consumption and
$CO_2$ emissions, highlight the energy efficiency of one-dimensional models like 1D CNN and 1D ResNet. - Model interpretation analysis reveals insights into AF detection using heart rate variability and raw ECG signals.
Discussion:
Despite the under-performed results, the Poincaré diagrams are still worth studying further because of the accessibility and inexpensive procedure. In the 1D convolutional models, the residual connections are useful to keep the model simple but not decrease the performance. Our approach in power measurement and model interpretation helped understand the numerical complexity and mechanism behind the model decision.
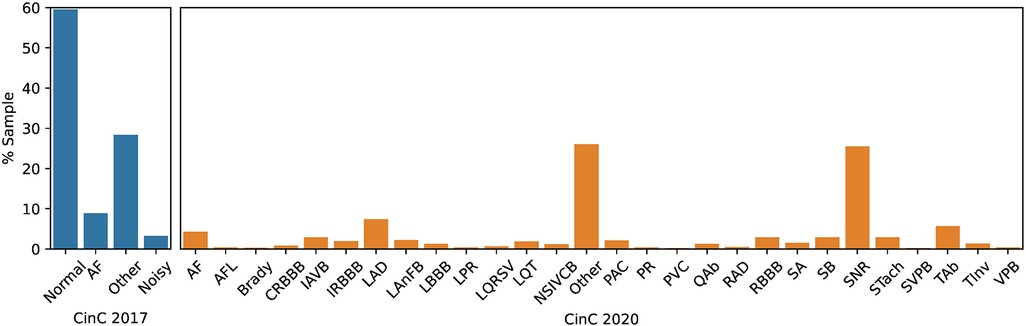
Dataset
Poincaré diagrams
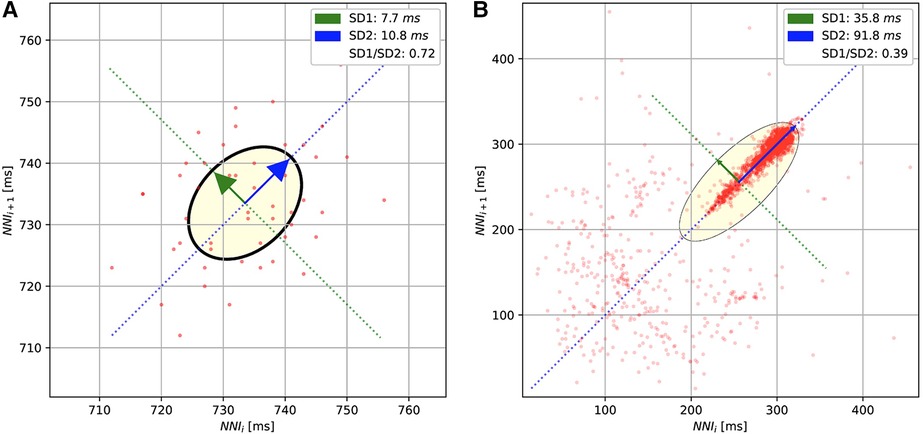
The Poincaré diagrams of the short-term (A) and long-term (B) ECGs. The diagrams plot the normal R-peak intervals (or NN intervals).
Pipeline

- Install the requirements:
pip install -r requirements.txt - Get the raw data in the official repository of CinC 2017 and CinC 2020. Run the script in
preprocessto get the preprocessed data. - Train: run the
shfile in folderscript - Run the Tensorboard to get the visualization of model training:
tensorboard --bind_all --logdir logs
| Dataset | Input Data | Model | F1 (5-fold CV) | SENS (5-fold CV) | SPEC (5-fold CV) | F1 (Test Set) | SENS (Test Set) | SPEC (Test Set) |
|---|---|---|---|---|---|---|---|---|
| CinC 2017 | Poincaré | ResNet50 | 0.70 (0.02) | 0.64 (0.03) | 0.82 (0.05) | 0.71 | 0.64 | 0.79 |
| CinC 2017 | Poincaré | DenseNet121 | 0.75 (0.02) | 0.71 (0.02) | 0.82 (0.02) | 0.77 | 0.73 | 0.80 |
| CinC 2017 | Raw Signal | 1D CNN | 0.81 (0.01) | 0.79 (0.01) | 0.86 (0.01) | 0.84 | 0.83 | 0.86 |
| CinC 2017 | Raw Signal | 1D ResNet | 0.82 (0.01) | 0.81 (0.01) | 0.87 (0.01) | 0.85 | 0.85 | 0.86 |
| CinC 2017 | Raw Signal | Kamaleswaran et al. | 0.80 (0.02) | 0.77 (0.02) | 0.85 (0.03) | 0.84 | 0.83 | 0.86 |
| CinC 2017 | Time Series | XGBoost | 0.64 (0.02) | 0.72 (0.09) | 0.51 (0.15) | 0.69 | 0.82 | 0.48 |
| CinC 2020 | Poincaré | ResNet50 | 0.47 (0.03) | 0.37 (0.03) | 0.81 (0.03) | 0.45 | 0.35 | 0.83 |
| CinC 2020 | Poincaré | DenseNet121 | 0.50 (0.00) | 0.40 (0.01) | 0.80 (0.01) | 0.50 | 0.41 | 0.80 |
| CinC 2020 | Raw Signal | 1D CNN | 0.67 (0.00) | 0.59 (0.01) | 0.89 (0.01) | 0.69 | 0.63 | 0.88 |
| CinC 2020 | Raw Signal | 1D ResNet | 0.71 (0.00) | 0.65 (0.01) | 0.92 (0.01) | 0.71 | 0.65 | 0.92 |
| CinC 2020 | Raw Signal | Natarajan et al. | 0.61 (0.02) | 0.82 (0.02) | 0.85 (0.02) | 0.66 | 0.80 | 0.90 |
| CinC 2020 | Time Series | XGBoost | 0.65 (0.01) | 0.62 (0.03) | 0.80 (0.03) | 0.65 | 0.65 | 0.78 |
Notes:
- F1: F1 Score
- SENS: Sensitivity
- SPEC: Specificity
- 5-fold CV: 5-fold Cross-validation
- Bold numbers indicate the performance of the best model.
| Dataset | Input Data | Model | Power (Wh) | CO2 (g) | Processing Time (ms) | Predicting Time (ms) | Total Inference Time (ms) |
|---|---|---|---|---|---|---|---|
| CinC 2017 | Poincaré | ResNet50 | 127 | 69 | 33.7 | 37.9 | 71.6 |
| CinC 2017 | Poincaré | DenseNet121 | 148 | 81 | 33.7 | 38.2 | 71.8 |
| CinC 2017 | Raw Signal | 1D CNN | 77 | 42 | 13.5 | 25.5 | 41.0 |
| CinC 2017 | Raw Signal | 1D ResNet | 44 | 24 | 13.5 | 18.8 | 32.2 |
| CinC 2017 | Raw Signal | Kamaleswaran et al. | 92 | 51 | 14.3 | 66.0 | 80.3 |
| CinC 2017 | Time Series | XGBoost | 42 | 23 | 1717.6 | 0.2 | 1717.8 |
| CinC 2020 | Poincaré | ResNet50 | 630 | 344 | 227.2 | 36 | 263.2 |
| CinC 2020 | Poincaré | DenseNet121 | 740 | 404 | 227.2 | 36.3 | 263.5 |
| CinC 2020 | Raw Signal | 1D CNN | 396 | 216 | 144.3 | 29.8 | 174.1 |
| CinC 2020 | Raw Signal | 1D ResNet | 223 | 122 | 144.3 | 21.6 | 165.9 |
| CinC 2020 | Raw Signal | Natarajan et al. | 497 | 271 | 4.9 | 833.6 | 838.5 |
| CinC 2020 | Time Series | XGBoost | 286 | 156 | 382.7 | 0.0 | 382.7 |
F1 score vs. CO2 emissions
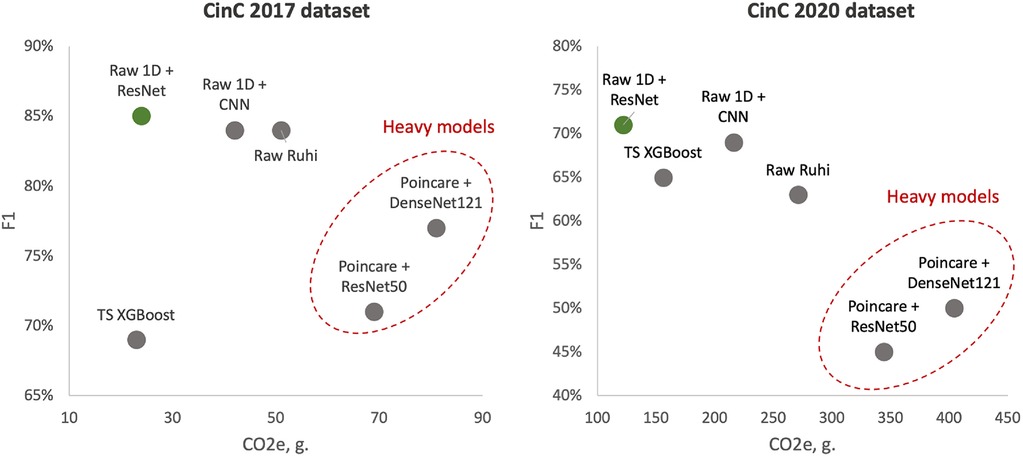
Left side - models learned over CinC 2017 dataset; right side - models learned over CinC 2020 dataset. Dotted red ellipses highlight relatively heavy models.
@article{pham2023,
    author={Pham, Huy and Egorov, Konstantin and Kazakov, Alexey and Budennyy, Semen},
    title={Machine learning-based detection of cardiovascular disease using ECG signals: performance vs. complexity},
    journal={Frontiers in Cardiovascular Medicine},
    volume={10},
    year={2023},
    url={https://www.frontiersin.org/articles/10.3389/fcvm.2023.1229743},
    doi={10.3389/fcvm.2023.1229743},
    issn={2297-055X}
}
Feel free to explore the research, reproduce experiments, and contribute to advancing cardiovascular disease detection using machine learning.