-
Notifications
You must be signed in to change notification settings - Fork 32
Update layout & rendering algorithms for plot
Plot exposes following methods affecting layout and rendering:
-
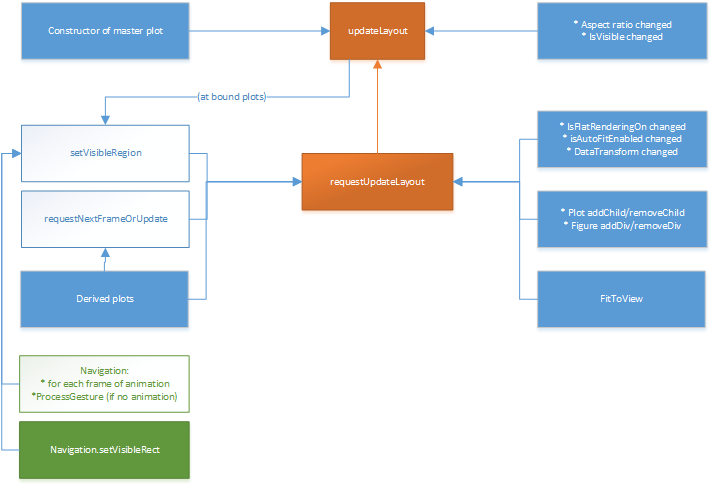
updateLayoutandrequestUpdateLayoutupdate screen positions and sizes of children DOM elements of the plot in accordance with the current screen size of the master plot’s host DIV element and the current visible rectangle in plot coordinates. TherequestUpdateLayoutis an async version of the method which allows to perform only most recent update, and thus improve interactivity for low-frame rate rendering. -
requestNextFrame(plot)invalidates the given plot and asynchronously requests rendering for it in current visible rectangle. -
requestNextFrameOrUpdate()is intended to be called from derived plots. This method efficiently invalidates the plot; * If auto-fit mode is enabled, and bounding box or padding changed, layout update is requested. * Otherwise, next frame is requested.
Private method Plot.setVisibleRegion disables auto-fit (if it is enabled), takes a desired visible rectangle, and saves it in the private field _plotRect, and asynchronously updates the layout which will make the saved rectangle actual. This method is called during the navigation’s animation and to synchronize visible rectangles of bound plots (see Bound plots). For the latter, the method takes the second argument which suppresses notifications for bound plots in the coming update layout (to avoid echo in the binding).
Update layout algorithm takes the current screen size of the master plot’s host element and the desired visible rectangle in plot coordinates (which depends on whether auto fit mode is enabled or not), then measures new layout and arranges the children elements:
- computes visible plot plane region from bounding boxes of dependent plots (if auto fit is enabled),
- computes and updates the physical layout (incl. size) of the plot’s inner HTML elements (this may concern visible plot region),
- forces rendering for each plot.
Layout update is done by Plot.arrange() method which gets the actual screen region for the plot and the plot is to be arranged in accordance. Default Plot adjusts the host div to take the given place. But particular plot implementations should override this method to alter their inner elements, too (e.g. plot’s canvas should also be resized).
Visible plot plane region is computed (aka “fit to view”) as follows:
- for each plot we call
Plot.getBoundingBox(); plot returns a bounding box in the plot plane or special valueundefined, indicating that the plot cannot determine the bounding box (probably, this plot depends on other plots, e.g. map plot or function-based plot); - building a total bounding box as a union of bounding boxes returned by the plots (ignoring undefined boxes);
- providing the total bounding box to the plot those returned
undefinedpreviously, so that they can extend or do not change it; - the final bounding box is a bounding box for all plots, but we also must consider thickness of plot’s elements (e.g. line thickness or marker size), which should be also visible even for all elements when we make fit to view, so we do the following:
- for each plot we call
Plot.getPadding; plot returns 4 values representing margins in screen pixels to be arranged around the bounding box.
See detailed diagram for the algorithm [here](https://raw.githubusercontent.com/predictionmachines/InteractiveDataDisplay/gh-pages/Plot Update Layout.pdf).
Extra padding is an extra value in pixels which is added to the padding computed for the plots. It’s goal is to improve visual quality of the picture. The value can be configured using InteractiveDataDisplay.padding constant as default
for all plots and individually using plot.padding.
Plot.requestUpdateLayout() sets a zero timeout to invoke Plot.updateLayout(). Such request cancels all previously requested renderings (requested via Plot.requestNextFrame) because layout update includes rendering. If rendering is requested after layout update is requested, it is ignored.
Home
FAQ
UI Guidelines
Export to SVG
Plot
Figure
Chart
ChartViewer
Polyline
Markers
Area
Heatmap
DOM Plot
Labels
Bing Maps
Intro
General bindings
Area plot
Bars plot
Polyline
Heatmap
Markers
Label plot
Box and whisker plot
Petals and BullEye plot
Axis
Palette Editor
Update layout
Axes
Legend
Color Palette
Navigation
Bound Plots
Tooltips and Probes
