The species digitizer package helps the process of georeferencing images and digitize species presence. The automated digitalization is based on a color, thus, contrasting colors with the background often produces the best results.
There are several option to install species digitizer:
-
To install the current development version found here, you need to download the built tar.gz package file and install it. Windows users may have to use Rtools to rebuild the package.
-
Clone the repository with git and build the package in your computer.
-
Use the devtools package in R. Example code:
    library(devtools)
    install_github("ptarroso/speciesdigitizer", subdir="source")
This package depends on other packages:
- tcltk (found in most R base installtions)
- sf
- terra
- vec2dtransf
This package has an graphical user interface (GUI) to assist the digitalization process. All package functionality is assessed through the GUI. After installation, run:
library(speciesdigitizer)
speciesdigitizer()
and it will start the simple GUI:
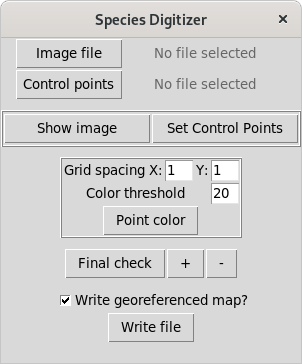
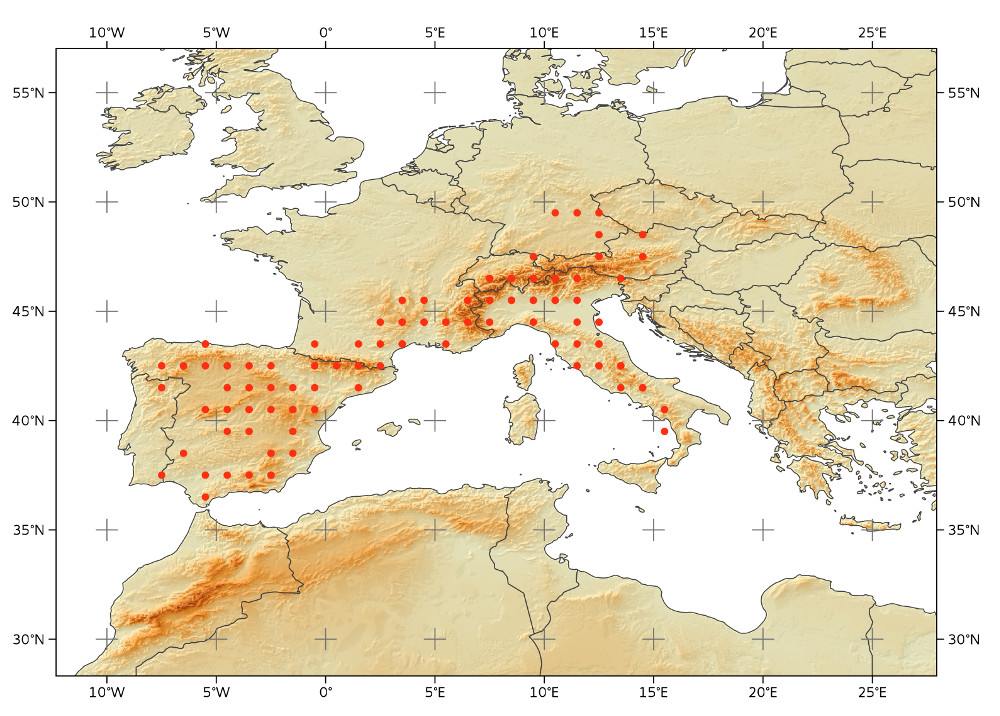
You can select the image to digitize with the respective button. We will proceed with the map in the examples folder. The control points are the real coordinates of the reference points in the map that we are going to use to help the georeferencing process. You can use as many as you want but always a minimum of 4 points. In this example there are clear marks in the map, but you can use any feature for which you know the coordinates (e.g. a small island, a particular place in the coastline, etc). Pay attention that the georeferencing in this package is based on the affine transformation, which means that only linear georeferencing is possible. So, if your map picture is in one reference system (lets say geographic Lats and Longs) do not try to give control points for other system that needs more wrapping than a simple rotation, scaling and shear mapping.
If a file named "ControlPoints.txt" is found in the same folder as the map picture, than it will be loaded automatically. Only the first two columns of the control points tables are read and it is expected to be coordinates of X position (longitude) and Y position (latitude), by this order. Other columns may be present in the file but are ignored.
Press Control points button to start providing the location of the points in the same order as in the ControlPoints.txt file. In the example there are four points and the order is lower left mark, upper left, upper right and lower right. After locating the points, they are shown in the map. Repeat until get the most precise location.
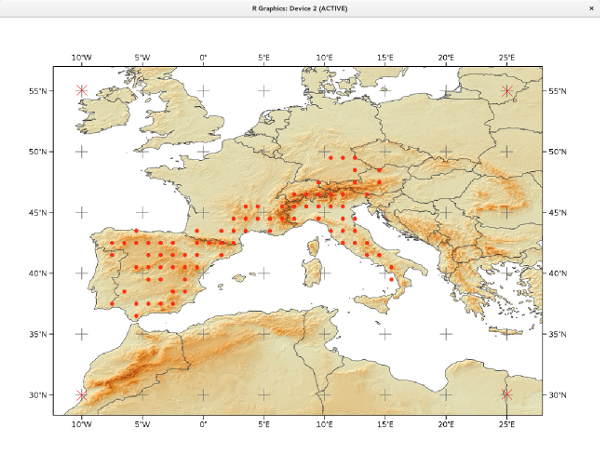
Now you can use the automated feature of the package to detect the points. Select the correct grid spacing for the points. In the example map, the points are in a 1x1 degree grid, so that is the spacing we should choose. Press "Point color" button and select any point you want to digitize. It will look for points with similar color and digitize all. The color threshold can be set to a value between 0 and 255 to narrow or widen the color search.
Those points with detect color within the threshold are represented as black and, in red, the found points based on the spacing provided. If you are happy with the digitalization you can proceed directly to write a file with the coordinated with the last button. If it needs some more visual check and removing/adding points, then press "Final check" button. It may take some time, depending on the size of your map picture. You should always use the smaller map picture possible that is readable.
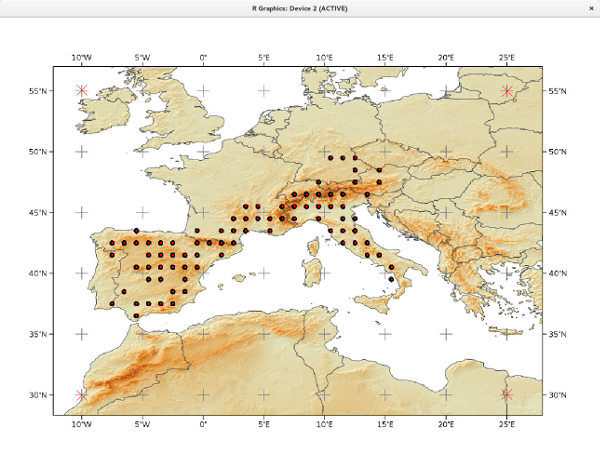
The final check will add a reference grid based on the spacing to the picture and the digitized points as green circles.

First check if the grid adjusts well to the information in the map. In the example, the coordinates marks are well located. If nor, try to provide better control points. Second, look to the points and check if you need to add more that were not found in the automated process or if you need to remove. You have the "+" button to add and the "-" button to remove. The process is the same for both: start clicking with left mouse button on the miss/extra points and, when finished, press the right button. If you are happy with the results, you can save the file with the "write" button. If you want to save the georeferenced original map, check the box above the button. This will copy the map with the same name as given before with an additional world file that provides the geo reference (note: works with tif and jpg).