Ejecutar en R
https://r-wasm.github.io/quarto-live/
- autorun autorun: true evaluates initial code cell contents automatically, once the WebAssembly engine has loaded into the page. That is, you do not need to click “Run Code” to see the initial output.
- caption
- echo: show source code in output
- edit Setting edit: false will create a read-only cell. Read only cells are displayed similarly to the usual pre-rendered code blocks, but are executed on the client under WebAssembly.In this mode only the source code will be shown when the page initially loads. After the WebAssembly engine has finished loading and evaluating the code, its output will be added to the cell dynamically.
- eval
- persist
- output: display execution
- runbutton: Show the “Run Code” button? If false, code is immediately evaluated. runbutton: false will remove the “Run Code” button from the editor UI. In this mode code is evaluated immediately as it is entered into the editor.
- startover: Show the “Start Over” button?
- warning
- min-lines 0 Minimum editor height in number of lines.
- include: false will execute code in the WebAssembly engine without adding its source code or any output to the resulting document. The option is equivalent to setting echo: false, output: false.
Cross-references to interactive code listings should be written using fenced div syntax. Create a fenced div with an id starting with lst-, then include the interactive code cell followed by the caption. Source
::: {#lst-ref}
mod <- lm(mpg ~ cyl, data = mtcars)
summary(mod)
An interactive R code block, with an example of fitting a linear model.
:::
See @lst-ref for details.
install.packages("dplyr", quiet = TRUE) library(dplyr)
starwars |> filter(height < 100) |> select(name, height, mass)
Designate a webr block as an exercise setup block by setting the setup: true cell option. Then, set the exercise cell option so as to match an existing exercise. The code in the exercise setup cell will be executed before every evaluation of the learner’s code.
Source
Fill in the blank so that the result of the sum is 10.
exercise.qmd
#| setup: true
#| exercise: ex_2
foo <- 1
bar <- 2
baz <- 3
#| exercise: ex_2
foo + bar + baz + ______
Shared setup
A setup block may be attached to multiple exercises by providing a list of exercises for the exercise cell option. The code in the setup cell will be executed before every evaluation of any of the listed exercises. Source
exercise.qmd
#| setup: true
#| exercise:
#|   - ex_a1
#|   - ex_a2
var_xyz <- c(1, 3, 7, 9, 13, 15)
#| exercise: ex_a1
var_xyz * 2
#| exercise: ex_a2
var_xyz ** 2
Calculate the average of all of the integers from 1 to 10.
#| exercise: ex_1_r
______(1:10)
#| exercise: ex_1_r
#| check: true
if (identical(.result, mean(1:10))) {
  list(correct = TRUE, message = "Nice work!")
} else {
  list(correct = FALSE, message = "That's incorrect, sorry.")
}
Find any result in learner output Source
Write R code that returns 2468 somewhere, even invisibly:
#| exercise: example_2
123
invisible(2468)
456
#| exercise: example_2
#| check: true
results <- Filter(\(x) inherits(x, "result"), .evaluate_result)
if(is.null(Find(\(x) x$value == 2468, results))) {
  list(correct = FALSE, message = "Incorrect, sorry.")
} else {
  list(correct = TRUE, message = "Correct!")
}
option Description default Default output, text as if output at an R console. paged-table Render with rmarkdown::paged_table(). kable Render with knitr::kable(). gt Render with gt::gt(). gt-interactive Render with gt::gt() as an interactive table. DT Render with DT::datatable(). reactable Render with reactable::reactable().
----
format: live-html
webr:
  render-df: gt-interactive
----
mtcars
https://teachingtechtogether.netlify.app/models
Este curso de introducción a la programación y estadística en R está diseñado para que los estudiantes adquieran habilidades fundamentales en bioestadística y programación en R que ler pemita comprender y resolver problemas, así como aplicarlo en su campo de estudio.
Es clave entender que sobrecargar a los estudiantes con mucha información sin primero construir un modelo mental (representación simplificada que permite resolver problemas) puede ser contraproducente. Según estudios (Muller, 2023), los estudiantes tienden a aferrarse a ideas erróneas si no se les confronta de manera activa con sus concepciones previas equivocadas. Por ello, los videos y recursos que utilizaremos abordarán estos conceptos erróneos comunes y los conceptos correctos en conjunto, facilitando un aprendizaje más profundo y efectivo.
Nuestro objetivo es guiar a los estudiantes a través de un proceso de aprendizaje ACTIVO que se centra en construir una comprensión sólida de los fundamentos antes de avanzar a conceptos específicos. Estos fundamentos capacitarán a los estudiantes para buscar información y aplicar lo que han aprendido de manera efectiva.
Las lecciones están diseñadas específicamente para gente sin previa experiencia, ayudándoles a construir sus modelos mentales mediante tutoriales. Estos tutoriales se diseñaron con un enfoque: mitigar el efecto aversivo de la falta de experiencia, donde materiales mal alineados pueden frustrar a los estudiantes dependiendo de su nivel de conocimiento. Cuando se presentan conceptos nuevos, el estudiante debe procesarlos en un tipo de memoria que, seguramente, te haz dado cuenta que no es la más eficiente: la memoria de trabajo o de corto plazo (p.ej. recordar un teléfono celular) Kalyuga et al., 2003. Debido a esto, en este curso minimizaremos la carga de memoria de trabajo de los estudiantes, permitiéndoles construir esquemas y automatizar procesos para procesar la información de manera más eficiente.
Se introducirán máquinas nocionales (Fincher et al. 2020), dispositivos pedagógicos que simulan entornos de programación simplificados para facilitar la comprensión de conceptos abstractos de una manera accesible. Estas máquinas nocionales permiten a los estudiantes interactuar con conceptos complejos de programación y estadística de una manera más tangible y práctica. No solo habilidades técnicas, sino también una verdadera pericia. El resultado es que podremos generar modelos mentales densamente conectados que permiten reconocer patrones y resolver problemas de forma eficiente, a menudo aparentemente sin esfuerzo (Siegmund, and Peitek y 2017).
Para lograr esto, el curso no te hará repetir mecánicamente las mismas tareas miles de veces. En cambio, nos enfocaremos en los conceptos teóricos (p.ej. conceptos de estadística), uso en R (en la misma diapositiva) y la práctica deliberada, que involucra abordar problemas reales, y aprender de la retroalimentación. Pasarás por diferentes etapas, desde recibir retroalimentación en las primeras etapas hasta llegar a autoevaluarte y evaluar código de otras personas con la habilidad que obtendrás en este curso.
Este curso adoptará un enfoque de aprendizaje cognitivo, que busca facilitar la transferencia de habilidades y conocimientos de manera efectiva. A través del uso de andamiaje y desvanecimiento, los instructores ofrecerán modelos de desempeño, mostrando no solo cómo resolver problemas, sino también explicando los principios detrás de cada decisión.
Verás múltiples ejemplos cuando se introduzcan nuevas ideas, para que puedas identificar patrones y generalizaciones clave. Además, los problemas se plantearán de maneras diversas para ayudarte a distinguir entre las características esenciales y las superficiales de los mismos.
Se te animará a reflexionar sobre tus propios procesos de resolución de problemas. Actividades como pensar en voz alta y criticar tu propio trabajo están diseñadas para fomentar una comprensión más profunda y autónoma. Como estudiante, tendrás la oportunidad de explorar problemas según tus intereses, lo que contribuirá a tu aprendizaje activo y personalización del conocimiento.
Esperamos que, al contextualizar el aprendizaje en situaciones del mundo real, y a través del fomento de la autoexplicación, puedas organizar y asimilar mejor las nuevas lecciones. Este enfoque te permitirá desarrollar habilidades de pensamiento crítico y aplicar lo aprendido de manera efectiva en situaciones prácticas.
En este curso, fomentaremos un enfoque en el aprendizaje individual activo, favoreciendo una transición del aprendizaje pasivo al activo para mejorar la retención y el éxito académico. Esto significa que en lugar de simplemente leer o mirar lecciones pregrabadas, te involucrarás haciendo ejercicios, discutiendo temas y explicando conceptos, lo que ayuda a consolidar la nueva información en tu memoria a largo plazo. La metacognición jugará un papel importante en tu aprendizaje. Al reflexionar sobre tus propios procesos de pensamiento, como lo hacen los músicos y los buenos docentes, podrás planificar, establecer metas y monitorear tu progreso de manera más efectiva. Esto te ayudará a comprender mejor lo que estás aprendiendo y a identificar áreas de mejora continua.
Además, aplicaremos la práctica distribuida, que es más efectiva que estudiar grandes bloques de tiempo en pocos días. Practicarás recordar lo aprendido mediante exámenes de práctica y resúmenes de memoria, lo que fortalecerá tu capacidad de acceder a la información almacenada más tarde. Resolver problemas varias veces desde cero y usar tarjetas de estudio son métodos que usaremos para reforzar tu recuerdo y detección de áreas donde necesitas concentración adicional.
Otra técnica que utilizaremos es la práctica intercalada, donde alternarás entre diferentes materias para crear más conexiones entre ellas, mejorando así tu comprensión global. Te alentamos a elaborar tus explicaciones para los temas, comparando conceptos nuevos con conocimientos previos para afianzar tu aprendizaje.
Por último, emplearemos la codificación dual, que combina palabras e imágenes, aprovechando la capacidad de tu cerebro para procesar la información visual y lingüística. Al presentar información de esta manera integrada, se refuerzan mutuamente, facilitando un aprendizaje más eficaz.
También se fomenta la colaboración en el foro. Al discutir y compartir ideas con tus compañeros, podrás ver diferentes perspectivas y enfoques, lo que enriquecerá tu comprensión y te ayudará a consolidar lo aprendido. Además, al explicar conceptos a otros, fortalecerás tu propia comprensión y retención de la información.
Por otro lado, observarás que la evaluación del curso no se basa únicamente en exámenes finales, sino que se enfoca en la evaluación formativa y continua. Esto significa que recibirás retroalimentación regular sobre tu progreso y desempeño, lo que te permitirá identificar áreas de mejora y ajustar tu enfoque de estudio en consecuencia. La evaluación formativa te ayudará a monitorear tu aprendizaje y a identificar tus fortalezas y debilidades, lo que te permitirá mejorar continuamente. Esto se hace con un sistema de experiencia tipo "juego" que te permitirá ver tu progreso y subir de nivel.
En el diseño de este curso, aplicaremos el método de reingeniería para asegurar que las lecciones sean efectivas y significativas para ti como estudiante. Este método incluye varios pasos clave:
- Conocer a los estudiantes: Crear perfiles de estudiantes tipo para comprender mejor a quien queremos ayudar y qué les motiva.
- Planificación inicial: Realizar una tormenta de ideas para determinar los temas a cubrir, las estrategias de enseñanza, los errores comunes esperados y qué no se incluirá.
- Definición de objetivos: Elaborar una evaluación sumativa que sirva como meta del curso, como un examen final o un proyecto, para clarificar el nivel de dominio esperado.
- Evaluaciones formativas: Desarrollar evaluaciones que permitan la práctica de los estudiantes y monitoreen su progreso, alineadas con la evaluación sumativa.
- Estructura del curso: Ordenar las evaluaciones formativas basándose en su dificultad y cómo motivarán a los estudiantes, creando un esquema de aprendizaje lógico y atractivo.
- Material de instrucción: Redactar materiales para guiar a los estudiantes de una evaluación formativa a la siguiente.
- Descripción del curso: Escribir un resumen que permita a los estudiantes potenciales conocer el curso y determinar si se adecúa a sus necesidades.
Además, el curso utilizará la taxonomía de Fink para estructurar objetivos de aprendizaje de manera complementaria y no jerárquica, abarcando desde el conocimiento fundamental hasta "aprender a aprender". Estos objetivos incluyen explicar conceptos clave, aplicar habilidades, integrar conocimiento, comprender aspectos humanos, desarrollar interés y mejorar habilidades de aprendizaje autónomo.
Aunque visualizar programas es una herramienta comúnmente utilizada en la enseñanza, investigaciones sugieren que la construcción activa de visualizaciones por parte de los estudiantes es más beneficiosa que simplemente observarlas. Proporcionaremos oportunidades para que construyas tus propias visualizaciones y rastrees la ejecución del código de manera práctica, ya que este enfoque se correlaciona con un mayor éxito y comprensión.
En el diseño e implementación de este curso, abordaremos varias prácticas para asegurar una enseñanza inclusiva, motivadora y efectiva, superando desafíos comunes en la configuración del entorno y la interacción con los estudiantes.
Configuración del Entorno:
Configurar un entorno de trabajo uniforme puede simplificar el proceso de enseñanza, pero no sin desafíos. Muchas veces se prefiere usar herramientas basadas en el navegador para evitar problemas de configuración, aunque esto puede crear dependencia en la calidad del WiFi. Daremos prioridad a que cada estudiante tenga acceso a las herramientas en su propio dispositivo, ayudando a asegurar que salgan del curso con una experiencia práctica realista.
Métodos de Enseñanza:
Programación Participativa en Vivo: Utilizaremos esta técnica para que los estudiantes observen el proceso de pensamiento y resolución de problemas en tiempo real. Esto promueve un aprendizaje activo y la capacidad de diagnosticar y corregir errores, lo cual es crucial en programación.
Predicción de Resultados: Involucraremos a los estudiantes pidiéndoles que predigan lo que sucederá al ejecutar un código. Esta práctica no solo promueve el pensamiento crítico, sino que también convierte la enseñanza en un proceso interactivo.
Fomentando la Motivación:
Las lecciones están diseñadas para fomentar los tres impulsores de la motivación intrínseca según la teoría de la autodeterminación: competencia, autonomía y relación. Ejercicios prácticos permitirán a los estudiantes sentir competencia y control, mientras que la interacción fomentará un sentido de comunidad.
Enfrentando Desmotivadores:
Nos enfocaremos en evitar desmotivadores como la imprevisibilidad, la indiferencia y la injusticia. Ofreceremos un entorno de aprendizaje estructurado y justo, enfatizando que las habilidades de programación pueden aprenderse y mejorarse con esfuerzo, independientemente de la aptitud percibida.
Accesibilidad e Inclusión:
Accesibilidad: Aseguraremos que el material del curso sea accesible, agregando títulos de descripción a las imágenes y haciendo controles de navegación accesibles. Este esfuerzo es fundamental para no restringir el acceso al contenido pedagógico.
Inclusión: Buscaremos crear un ambiente acogedor y seguro, reconociendo y valorando la diversidad, tratando de manera justa a mujeres, grupos raciales y étnicamente subrepresentados, y otras personas marginadas.
Ritmo y Repetición:
Permitiremos que los estudiantes trabajen a su propio ritmo y revisen el material según sea necesario, especialmente para quienes puedan enfrentar dificultades auditivas o de lectura.
En resumidas cuentas, este curso no solo se centrará en impartir conocimientos técnicos, sino que también se comprometerá a brindar un entorno de aprendizaje equitativo, accesible e inclusivo que motive y respalde a todos los estudiantes en su viaje educativo.
En el contexto de la enseñanza en línea, es crucial no confundir los términos "en línea" con "automatizado". Aunque el contenido grabado puede ser conveniente, a menudo carece de la capacidad de abordar los conceptos erróneos individuales de los estudiantes, especialmente los principiantes, quienes pueden necesitar diversas explicaciones para comprender completamente un tema.
Para maximizar los aspectos positivos y evitar los negativos al enseñar en línea:
Plazos claros y regulares: Establece y comunica claramente los plazos, fomentando un ritmo de estudio constante entre los estudiantes.
Actividades mínimas sincronizadas: Limita las actividades en vivo para evitar conflictos de horario, permitiendo que los estudiantes gestionen su tiempo más efectivamente.
Contribuciones al conocimiento colectivo: Fomenta la colaboración mediante tareas como tomar notas compartidas, actuar como escribas o aportar a conjuntos de problemas colectivos.
Grupos pequeños para trabajo en equipo: Anima a los estudiantes a colaborar en grupos pequeños con reuniones sincrónicas ocasionales para mantener la motivación sin complicar la agenda de cada uno.
Código de conducta: Establece un entorno seguro para la participación en línea mediante un código de conducta claro.
Lecciones breves: Opta por lecciones cortas en lugar de largas conferencias, reduciendo la carga cognitiva y facilitando el mantenimiento y actualización de los materiales.
Videos que fomenten participación: Usa videos para mostrar acciones y procesos, como el uso de herramientas de programación, ya que pueden ser más efectivos que lecturas extensas.
Identificación temprana de errores conceptuales: Si se detectan dificultades comunes en los estudiantes, brinda explicaciones alternativas y ejercicios adicionales para reforzar el aprendizaje.
En cuanto a la plataforma de enseñanza, es vital elegir una que sea fácil de usar tanto para ti como para tus estudiantes. Una opción es un sistema de gestión del aprendizaje como Moodle o Sakai. Alternativamente, puedes crear una solución personalizada utilizando herramientas como Discord o Telegram para el chat, Google Hangouts para videollamadas y plataformas como WordPress o Google Docs para la colaboración en documentos. Lo más importante es seleccionar las herramientas con las que los estudiantes se sientan más cómodos, incluso si te requiere un esfuerzo adicional para aprender su manejo.
Implementar estas prácticas ayuda a crear un entorno de aprendizaje en línea efectivo que sea accesible y atractivo, mejorando así la experiencia educativa para todos los estudiantes.
Para maximizar el aprendizaje de los estudiantes en programación, es fundamental incorporar una variedad de ejercicios que aborden diferentes habilidades y enfoques pedagógicos. Aquí algunos métodos y ejercicios que seguiremos en el curso:
Preguntas de Opción Múltiple: Estas serán más eficaces si las respuestas incorrectas abordan conceptos erróneos específicos. Esto ayuda a identificar y corregir malentendidos comunes durante el aprendizaje.
Programar y Ejecutar: Los estudiantes escribirán código para generar una salida específica. Aunque esto puede ser difícil de evaluar por la variedad de soluciones posibles, se puede optimizar evaluando la salida o proporcionando un conjunto pequeño de pruebas para validaciones preliminares.
Escribir Pruebas: En vez de solo escribir código, los estudiantes también aprenderán a escribir pruebas que validen si un fragmento de código cumple con las especificaciones dadas, una habilidad crucial para la programación y la comprensión del trabajo del docente.
Completar Espacios en Blanco: Este enfoque ayuda a consolidar el aprendizaje mediante la finalización de fragmentos de código ya comenzados, reforzando la comprensión de sintaxis y lógica.
Problemas de Parsons: Consisten en reorganizar e indentar líneas de código. Esto desafía a los estudiantes a comprender la estructura del código y es efectivo para aprender sobre la lógica de programación.
Seguir la Ejecución: Este tipo de ejercicio requiere que los estudiantes sigan el flujo del código, esencial para depuración y para comprender bucles y condicionales.
Ejecución Inversa: Los estudiantes deducen la entrada que produjo un determinado resultado. Esto fortalece las habilidades de razonamiento lógico y depuración, especialmente al tratar con errores.
Diagramas Conceptuales y de Código: Los estudiantes crearán y etiquetarán diagramas, una manera de visualizar y consolidar conceptos. Al etiquetar en lugar de crear diagramas desde cero, se facilita la evaluación y escalabilidad del método.
Revisión de Código: Revisar y marcar problemas en el código usando rúbricas proporcionadas. Esta práctica no solo mejora la habilidad para detectar errores, sino que también da una perspectiva sobre buenas prácticas de codificación.
Estos métodos no solo enriquecen el aprendizaje experiencial, sino que también permiten a los estudiantes practicar habilidades críticas en programación, prepararles mejor para aplicaciones del mundo real, y desarrollar un pensamiento lógico más sólido.
6 Aprendizaje individual
La estrategia más efectiva es hacer un cambio de aprendizaje pasivo a aprendizaje activo National Academies of Sciences, Engineering, and Medicine (2018), ya que mejora la tasa de rendimiento y reduce la tasa de fracaso Freeman et al. (2014):
Pasivo Activo Leer sobre un tema Hacer ejercicios Mirar un video Discutir un tema Asistir a una clase Tratar de explicar un tema
el aprendizaje activo es más efectivo porque retiene la información nueva en la memoria a corto plazo por más tiempo, lo cual aumenta la probabilidad que sea codificada con éxito y almacenada en la memoria a largo plazo. Al usar la nueva información a medida que llega, tus estudiantes pueden construir y fortalecer los lazos entre la información nueva y la información que ya poseen, lo cual a su vez incrementa las chances de que puedan recuperarla más tarde.
La otra clave para poder sacarle más provecho al aprendizaje es la metacognición o, en otras palabras, pensar sobre lo que una/uno está pensando. Así como las/los músicas/os escuchan lo que están tocando, y las/los buenas/os docentes reflexionan sobre su enseñanza (Chapter 9), tus estudiantes aprenderán mejor y más rápido si hacen planes, fijan metas y monitorean su progreso.
Práctica distribuida
Diez horas de estudio repartidas en cinco días es más efectivo que dos días de estudio con cinco horas, y mucho mejor que un día de diez horas. Por lo tanto, deberías crear un cronograma de estudio en el que distribuyas tus actividades de estudio a lo largo del tiempo: reserva al menos media hora para estudiar cada tema, cada día, en vez de amontonar todo para la noche antes del examen Kang (2016).
La práctica de recordar lo aprendido
El factor limitante de la memoria a largo plazo no es retener (qué se almacena) sino recordar (qué puede accederse). La habilidad de recordar una información específica puede entrenarse, asi que para mejorar los resultados en situaciones reales es útil hacer exámenes de práctica o resumir en detalle un tema de memoria y luego revisar qué has recordado y qué no. Por ejemplo, Karpicke and Roediger (2008) encontró que hacer exámenes de forma repetida mejora el recuerdo de listas de palabras, de un 35% a un 80%.
La habilidad de recordar mejora cuando en la práctica se utilizan actividades similares a las que se evalúan. Por ejemplo, escribir entradas en un diario personal ayuda con las preguntas de opción múltiple, aunque menos que hacer exámenes de práctica Miller (2016). Este fenómeno se llama transferencia apropiada de procesamiento.
Una manera de ejercitar las habilidades para recordar es resolver un mismo problema dos veces. La primera vez, hacerlo completamente de memoria, sin notas o discusiones con pares. Después de evaluar tu propio trabajo con una rúbrica de respuestas distribuidas por la/el docente, resuelve el problema de nuevo, utilizando el material de apoyo que quieras. La diferencia entre ambos te muestra qué tan bien pudiste recordar y aplicar el conocimiento.
Otro método (mencionado previamente) es crear tarjetas de estudio. Las tarjetas físicas tienen una pregunta en un lado y la respuesta en el otro, y existen muchas aplicaciones para generarlas disponibles para teléfono móvil. Si estás estudiando en grupo, intercambiar las tarjetas de estudio con tus colegas te ayudará a descubrir ideas importantes que tal vez habías obviado o malinterpretado.
Práctica intercalada
Una forma de espaciar la práctica es intercalar el estudio de diferentes temas: en vez de dominar un tema, luego el segundo y el tercero, alterna las sesiones de estudio. Aún mejor, cambia el orden: A-B-C-B-A-C es mejor que A-B-C-A-B-C, que a la vez es mejor que A-A-B-B-C-C Rohrer, Dedrick, and Stershic (2015). Esto funciona porque intercalar permite la creación de más vínculos entre los diferentes temas, lo cual mejora el aprendizaje.
Elaboración
Explicarte los temas a tí misma/o mientras estudias permite entenderlos y recordarlos. Una forma de hacer esto es complementar la respuesta en un examen práctico con la explicación de por qué la respuesta es correcta o, al contrario, con una explicación de por qué otras respuestas plausibles no serían correctas. Otra alternativa es decirte a tí misma/o cómo una nueva idea es similar o diferente a una que ya hayas visto previamente.
Codificación Dual
La última de las seis estrategias principales descriptas en [Learning Scientists][learning-scientists] es presentar palabras e imágenes juntas. Como discutimos en la Section 5.1, diferentes subsistemas en nuestro cerebro manejan y almacenan la información lingüística y visual, de tal manera que, si se presenta información complementaria por ambos canales, se refuerzan mutuamente.
7 Un método similar denominado reingeniería funciona muy bien para el diseño de lecciones. Este método fue desarrollado en forma independiente en Wiggins and McTighe (2005),Biggs and Tang (2011),Fink (2013) y está resumido en McTighe and Wiggins (2013). En forma simplificada, sus pasos son:
Crea o recicla personas tipo (concepto discutido en la siguiente sección) para imaginar a quiénes estás intentando ayudar y qué les atraerá.

Haz una tormenta de ideas para tener una idea aproximada de lo que quieres cubrir, cómo lo vas a hacer, qué problemas o conceptos erróneos esperas encontrar, qué no no se va a incluir, etcétera. Dibujar mapas conceptuales puede ayudar mucho en esta etapa (Section 4.1).

Crea una evaluación sumativa (Section 3.1) para definir tu objetivo general. Dicha evaluación puede ser el examen final para un curso o el proyecto final para un taller de un día. Independientemente de su forma o extensión, la evaluación sumativa te mostrará lo lejos que esperas llegar más claramente que una lista puntual de objetivos.

Crea evaluaciones formativas, lo cual le dará a tus estudiantes una oportunidad para practicar lo que están aprendiendo. Las evaluaciones formativas también te dirán a ti (y a tus estudiantes) si están progresando y dónde deben centrar su atención. El mejor camino para hacer esto es listar los conocimientos y las habilidades involucradas en la evaluación sumativa que desarrollaste en el paso anterior: luego, deberás crear una evaluación formativa para cada ítem.

Ordena las evaluaciones formativas para crear un esquema del curso en función de su complejidad, sus dependencias, y cuán bien los temas motivarán a tus estudiantes (Section 11.1).

Escribe material para conseguir que tus estudiantes pasen de una evaluación formativa a la siguiente. Cada hora de instrucción debe constar de tres a cinco de estos episodios.

Escribe una descripción resumida del curso para ayudar a que tu público objetivo lo encuentre y averigue si es el curso adecuado.
Fink (2013), el cual define aprendizaje en términos del cambio que se supone que debe producirse en el/la estudiante. La taxonomía de Fink también tiene seis categorías, pero a diferencia de las de Bloom ellas son complementarias y no jerárquicas:
Conocimiento fundamental:
comprender y recordar información e ideas. (recordar, comprender, identificar)
Aplicación:
habilidades, pensamiento crítico, gestión de proyectos. (usar, resolver, calcular, crear)
Integración:
conectar ideas, experiencias de aprendizaje y vida real. (conectar, relatar, comparar)
Dimensión humana:
aprender sobre sí mismo/a y sobre otras personas. (llegar a verse a sí mismo/a, entender a las demás personas en términos de, decidir transformarse en)
Cuidado:
desarrollar nuevos sentimientos, intereses y valores. (emocionarse, estar preparado/a para, valorar)
Aprendiendo a aprender:
convertirse en mejor estudiante. (identificar la fuente de información para, enmarcar preguntas útiles sobre)
Un conjunto de objetivos de aprendizaje basados en la taxonomía de Fink para un curso introductorio sobre HTML y CSS sería:
Explicar qué son las propiedades de CSS y cómo funcionan los selectores de CSS.

Diseñar una página web usando etiquetas comunes y propiedades de CSS.

Comparar y contrastar escribir en HTML y CSS con escribir con herramientas de escritorio de edición y publicación.

Identificar y corregir problemas en páginas web de muestra que dificultarían la interacción de las personas con discapacidad visual.

Describir las características de los sitios web favoritos cuyo diseño te atraiga de forma particular y explicar el por qué.

Describir tus dos fuentes de información en línea favoritas sobre CSS y explicar qué te gusta de ellas.
Ayuda la visualización?
Visualizar la ejecución de un programa es una idea siempre popular, y herramientas como el tutor de Python en línea Guo (2013) y [Loupe][loupe] (que muestra cómo funciona un bucle de eventos de JavaScript) son útiles para enseñar. Sin embargo, las personas aprenden más al construir visualizaciones que al ver visualizaciones construidas por otras personas Stasko et al. (1998),Cetin and Andrews-Larson (2016), entonces, ¿las visualizaciones realmente ayudan al aprendizaje?
Para responder esto, Cunningham et al. (2017) replicaron un estudio previo sobre los tipos de esquemas que realizan las/los estudiantes cuando rastrean la ejecución del código. Encontraron que no hacer esquemas se correlaciona con un menor éxito, mientras que el seguimiento de los cambios de valor de una variable escribiendo los nuevos valores cerca de su nombre a medida que cambian fue la estrategia más efectiva.
Vihavainen, Airaksinen, and Watson (2014) examinó la mejora promedio en las tasas de aprobación de varios tipos de intervenciones en clases de programación.
Colaboración:
Actividades que fomenten la colaboración entre las/los estudiantes, ya sea en aulas o en laboratorios.
Cambio del contenido:
Se modificaron o actualizaron partes del material.
Contextualización:
El contenido y las actividades del curso se alinearon con un contexto específico, como juegos o medios.
CS0:
Creación de un curso preliminar a tomar antes del curso introductorio de programación; podría organizarse solo para algunas personas (por ejemplo, si están en riesgo de abandonar).
Temática de juego:
Se introdujo una componente de juego en el curso.
Esquema de calificación:
Un cambio en el sistema de calificación, como, por ejemplo, aumentar la importancia de las actividades de programación y reducir la del examen.
Trabajo en equipos:
Actividades con un mayor compromiso de trabajo en grupo, como el aprendizaje en equipo y cooperativo.
Recursos multimedia:
Actividades que usen explícitamente el uso de recursos multimedia (Chapter 11).
Apoyo de colegas:
El apoyo de pares en forma de parejas, grupos, mentoras/es contratadas/os o tutorías.
Otro apoyo:
Un término general para todas las actividades de apoyo, por ejemplo, mayor cantidad de horas docentes, canales de ayuda adicionales, etc.
9 Enseñar como un arte performativo
os métodos que vamos a presentar se conocen como programacion participativa en vivo y demostracion participativa en vivo.
La codificación participativa en vivo es una técnica en la que la persona que enseña escribe y explica el código en frente de la clase mientras que sus estudiantes le siguen a la par, escribiendo y ejecutando el mismo código a medida que avanzan (Nederbragt (2020)).
Esta es una estrategia eficaz para enseñar a programar (Rubin (2013),Haaranen (2017),Raj et al. (2018)), ya que:
Permite que les estudiantes vean el proceso de pensamiento de quien enseña y sus técnicas de resolución de problemas en tiempo real mientras programan, facilitando la transferencia de conocimiento: las personas aprenden más de lo que enseñamos conscientemente al observar cómo hacemos las cosas.

Posibilita una enseñanza activa al permitir a los y las docentes seguir los intereses, las preguntas y los comentarios de sus estudiantes.Una presentación de diapositivas es como una vía de ferrocarril: podrá ser un viaje suave, pero tienes que decidir hacia dónde vas con anticipación. Programar en vivo es como manejar un vehículo todo terreno: podrá ser más accidentado, pero es mucho más fácil cambiar de dirección e ir hacia donde la gente quiere.

Posibilita un aprendizaje activo al involucrar a tus estudiantes, lo que les ayuda a convertirse en practicantes activos en lugar de observadores pasivos del proceso de programación. Sus preguntas pueden responderse inmediatamente y los conceptos erróneos pueden corregirse programandolos. Los ejercicios permiten practicar en el momento el uso del material incluyendo diferentes alternativas.

Disminuye la velocidad de la persona que está enseñando: si tiene que escribir el programa a medida que avanza su velocidad es mucho menor a la que tendría usando diapositivas o un codigo pre-armado. Esto dismunuye la carga cognitiva de la memoria a corto plazo y le da mas tiempo a tus estudiantes para poder realizar las actividades y realizar preguntas antes de pasar al siguiente concepto.

Permite enseña cómo diagnosticar y corregir errores. Resolver errores es una tarea crucial de la programacion. La programacion en vivo nos permite cometer errores cuando programos (ya sean deliverados o no) permitiendonos explicar como es el proceso de resolucion. Ademas, les muestra a tus estudiantes que los errores son parte del proceso y que incluso quien ensena los puede cometer, dandoles lugar para que cometan errores y nos puedan hablar sobre ello.

Demuestra el orden en que se deben escribir los programas. Cuando Ihantola and Karavirta (2011) observaron cómo las personas resuelven problemas de Parson, encontraron que quienes tienen experiencia programando usualmente ubican la identificación del método al principio, luego agregan la mayor parte del control de flujo (es decir, bucles y condiciones), y solo después de eso, agregan detalles como la inicialización de variables y el manejo de casos especiales. Este método “fuera de orden” es ajeno para las personas novatas, que leen y escriben código en el orden en que se presenta en la página; ver el código les ayuda a descomponer los problemas en sub-metas que pueden abordar una a la vez. La programación en vivo además les da a quienes están enseñando la chance de enfatizar la importancia de los pequeños pasos con comentarios frecuentes (Blikstein et al. (2014)) y la importancia de definir un plan en vez de hacer cambios más o menos aleatorios y esperar que eso mejore las cosas (Spohrer, Soloway, and Pope (1985)).
Como toda tecnica de ensenanza, hablar mientras se escribe código en frente de un público requiere práctica. La mayoría de las personas indican que el nivel de dificultad rápidamente se vuelve igual que hablar con una presentación de diapositivas. Las secciones que siguen ofrecen consejos sobre cómo mejorar la manera de ensenar con programacion participativa en vivo.
las personas principiantes nunca deben comenzar a hacer ejercicios con una página o pantalla en blanco, ya que a menudo les resulta intimidante o desconcertante.Modificar el código existente en lugar de escribir código nuevo desde cero no sólo proporciona a tus estudiantes una estructura: también está más cerca de lo que harán en la vida real. S
10.10 Configuración del entorno de tus estudiantes
us estudiantes para que todos trabajen exactamente con las mismas herramientas, pero esto presenta un nuevo conjunto de problemas. diferentes de atajos de teclado para cosas como copiar y pegar, e incluso practicantes competentes se confundirán sobre qué está sucediendo exactamente y dónde.
La configuración es tan complicada que muchas/os docentes prefieren que se usen herramientas basadas en el navegador. Sin embargo, esto hace que la clase dependa del WiFi (que puede ser de calidad muy variable) y no satisface el deseo de las/los estudiantes de irse con sus propias máquinas listas para su uso en el mundo real.
10.11 Otras prácticas de enseñanza
Comienza con introducciones
Comienza tu clase presentándote. Si eres una persona experta, cuéntales un poco cómo llegaste a donde estás; si solo estás dos pasos por delante de ellos, enfatiza lo que tienes en común con ellas/os. Digas lo que digas, la meta es hacerte más accesible y fomentar la creencia de que pueden tener éxito.
10.11.8 Pide que tus estudiantes hagan predicciones
Las investigaciones han demostrado que las personas aprenden más de las demostraciones si se les pide que predigan lo que sucederá Miller et al. (2013). Esta actividad encaja naturalmente en la programación en vivo: después de agregar o cambiar algunas líneas de un programa, pregunta a la clase qué sucederá cuando se ejecute. Si el ejemplo es incluso moderadamente complejo, la predicción puede servir como una pregunta motivadora para una ronda de instrucción por pares.
Wlodkowski and Ginsberg (2017). De acuerdo a la [teoría de la autodeterminación][self-determination-es], los tres impulsores de motivación intrínseca son:
Competencia:
la sensación de que sabes lo que haces.
Autonomía:
la sensación de estar en control de tu propio destino.
Relación:
la sensación de estar conectado/a con las demás personas.
Una lección bien diseñada fomenta estos tres impulsores. Por ejemplo, un ejercicio de programación puede permitir que los/las estudiantes practiquen con las herramientas que necesitan usar para resolver un problema mayor (competencia), aborden las partes del problema en el orden que quieran (autonomía), y conversen con sus pares (relación).
Las cosas que se dominan rápido y son útiles de inmediato se deben enseñar primero, incluso si no se consideran fundamentales para personas que ya son practicantes competentes, porque unas pocas victorias iniciales fortalecerán la confianza de tus estudiantes en sí mismos/as y en su docente. Por el contrario. aquellas cosas que son difíciles de aprender y no son útiles a tus estudiantes en su etapa actual de desarrollo deben omitirse por completo, mientras que los temas en la diagonal se deben sopesar entre sí.
Hay tres desmotivadores principales para estudiantes adultos/as:
Imprevisibilidad:
desmotiva a las personas porque si no hay una conexión confiable entre lo que hacen y el resultado que logran, no hay razón para que intenten hacer nada.
Indiferencia:
desmotiva porque los/las estudiantes que creen que el/la docente o el sistema educativo no se preocupan por ellos/as, no se van a preocupar por aprender la clase.
Injusticia:
desmotiva a las personas desfavorecidas por razones obvias. Lo sorprendente es que también desmotiva a las personas que se benefician de la injusticia: consciente o inconscientemente, les preocupa que algun dia se encuentren en el grupo desfavorecido Wilkinson and Pickett (2011).
Dolores de cabeza de instalación de software.
El primer contacto de las personas con programación o con herramientas nuevas de programación suele a ser desmoralizador y creer que algo es difícil de aprender es una profecía autocumplida. No es solamente el tiempo que toma en configurar o el sentimiento de que es injusto tener que depurar algo que depende del conocimiento que aún no tienen. El problema real es que con cada falla refuerzan su creencia de que tendrán una mejor chance de cumplir con la fecha límite del próximo jueves si siguen haciendo las cosas como siempre las han hecho.
Si la gente cree que la competencia en alguna área es intrínseca (es decir, que tienes “el gen” para ella o no), a todos/as les va peor, incluyendo a quienes supuestamente están en ventaja. La razón es que si a alguien no le va bien al principio, asume que les falta esa aptitud, lo que predispone su rendimiento en el futuro. Por otro lado, si la gente cree que una habilidad se aprende y se puede mejorar, en promedio, les irá mejor.
Accesibilidad
Colocar las lecciones y los ejercicios fuera del alcance de alguien es tan desmotivador como parece, y es muy fácil hacerlo sin darse cuenta. Por ejemplo, las primeras lecciones de programación en línea que escribí tenían una transcripción de la narración al lado de las diapositivas, pero no incluían el código fuente: eso estaba en capturas de pantalla de diapositivas de PowerPoint. Alguien utilizando un [lector de pantalla][screen-reader-es] podía entonces oír lo que se decía sobre el programa, pero no sabía qué era realmente el programa. No siempre es factible adaptarse a las necesidades de cada estudiante, pero agregar títulos de descripción a las imágenes y hacer que los controles de navegación sean accesible a personas que no pueden usar el mouse puede hacer una gran diferencia.
Permite el propio-ritmo y la repetición
para las personas con problemas de lectura o audición.
Inclusión
as. En la computación, requiere hacer un esfuerzo positivo para tratar mejor y generar un ambiente amigable y seguro para las mujeres, grupos raciales o étnicos subrepresentados, personas con diversas orientaciones sexuales, ancianos/as, personas con dificultades físicas, personas que estuvieron encarceladas, los/las desfavorecidos/as económicamente, y todas las demás personas que no encajen en el grupo demográfico de hombres blancos/asiáticos prósperos de Silicon Valley.
Mitiga activamente el comportamiento que puede resultar intimidante para algunos/as estudiantes
por ejemplo el uso de jerga o “preguntas” que se hacen para mostrar conocimiento.

Reescritura de la historia

Abbate (2012) describe las carreras y logros de las mujeres que le dieron forma a la historia temprana de la computación, pero que con demasiada frecuencia han sido eliminadas de ella; Ensmenger (2003),Ensmenger (2012) describe cómo la programación pasó de ser una profesión femenina a una masculina en la década de 1960, mientras Hicks (2018) examina cómo Gran Bretaña perdió su dominio inicial en la computación discriminando sistemáticamente en contra de sus trabajadores más cualificados: las mujeres. (Mira Miltner (2018) para obtener una reseña de los tres libros.) Hablar de esta historia hace que algunos hombres en computación se sientan incómodos; en mi opinión, esa es una buena razón para hacerlo.
La misoginia en los videojuegos, el uso de “encaje cultural” en la contratación para excusar prejuicios conscientes o inconscientes, una cultura de silencio en torno al acoso y la creciente desigualdad en la sociedad que produce privilegios preparatorios (Section 10.5) no son culpa de una persona en particular, pero solucionarlos es responsabilidad de todos/as. Como docente, tienes más poder que la mayoría; [este taller][frameshift-workshop] tiene excelentes consejos prácticos sobre cómo ser un/a buen/a aliado/a, y su consejo probablemente es más importante que cualquier cosa que te enseñe este libro sobre la enseñanza.
12 Enseñar en línea
confundir “en línea” con “automatizado”.
Una razón es que el contenido grabado es ineficaz para muchas personas principiantes porque no puede aclarar los conceptos erróneos individuales (Chapter 3): si no entienden una explicación la primera vez, por lo general, no hay una explicación alternativa para ofrecer.
Margaryan, Bianco, and Littlejohn (2015),Miller (2016),Nilson and Goodson (2017) describen formas de acentuar los aspectos positivos en la lista anterior evitando los negativos:
Haz que los plazos sean frecuentes y bien publicitados,
y aplícalos para que tus estudiantes entren en ritmo de trabajo.
Manten al mínimo las actividades sincronizadas de todas las clases, como conferencias en vivo
para que las personas no se pierdan cosas debido a conflictos de agenda.
Haz que tus estudiantes contribuyan al conocimiento colectivo,
ej. tomar notas compartidas (Section 10.7), servir como escribas en el aula o contribuir con problemas a conjuntos de problemas compartidos (?sec-individual-peer).
Anima o solicita a tus estudiantes que realicen parte de su trabajo en grupos pequeños,
los cuales sí tienen actividades sincrónicas en línea, como por ejemplo una discusión semanal. Esto ayuda a las/los estudiantes a mantener su compromiso y motivación sin crear demasiados problemas de agenda. (Ver el Chapter 23 para obtener algunos consejos sobre cómo hacer que estas discusiones sean justas y productivas.)
Crea, publicita y haz cumplir un código de conducta.
para que toda la clase pueda participar en los debates en línea (Section 10.1).
Utiliza muchas lecciones breves en lugar de pocos fragmentos largos al estilo conferencias
para minimizar la carga cognitiva y brindar muchas oportunidades para la evaluación formativa. Esto también ayuda con el mantenimiento de las lecciones: si todos tus videos son cortos, simplemente puedes volver a grabar cualquiera que necesite actualización, lo que a menudo es más barato que intentar arreglar videos largos.
Usa videos para fomentar la participación en lugar de instruir.
Dejando de lado las discapacidades (Section 11.3), las/los estudiantes pueden leer más rápido de lo que tú puedes hablar. La excepción a esta regla es que el video es la mejor manera de enseñar verbos (acciones): grabaciones breves de tu pantalla que muestran cómo usar un editor, cómo recorrer el código en un depurador, y así sucesivamente, son más eficaces que las capturas de pantalla con texto.
Identifica y aclara tempranamente conceptos erróneos.
Si los datos muestran que las/los estudiantes tienen dificultades con algunas partes de una lección, crea explicaciones alternativas de esas partes y ejercicios adicionales para que practiquen.
Todo esto tiene que ser implementado de alguna manera, lo que significa que necesitas alguna clase de plataforma de enseñanza. Puedes utilizar tanto un sistema de gestión del aprendizaje (learning management system, en inglés) todo en uno como [Moodle][moodle] o [Sakai][sakai], o generar uno por tu cuenta usando [Discord][discord], [Telegram][telegram] o [Zulip][zulip-chat] para el chat, [Google Hangouts][google-hangouts] o [appear.in][appear-in] para videoconferencias, y [WordPress][wordpress], [Google Docs][google-docs], [HackMD][hackmd], Etherpad o cualquier número de sistemas wiki para la autoría colaborativa. Si recién estás comenzando, elige lo que sea más fácil de configurar y administrar y lo que sea más familiar para tus estudiantes. Si te enfrentas a una elección, la segunda consideración es más importante que la primera: esperas que las personas aprendan mucho en tu clase, por lo que es justo que tú aprendas a manejar las herramientas con las que se sientan más cómodas.
13 ejercicios
as preguntas de opción múltiple son más efectivas cuando las respuestas incorrectas sondean conceptos erróneos específicos.
programar y ejecutar, donde el/la estudiante escribe un código que produce una salida especificada.
Los ejercicios de programar y ejecutar ayudan a las personas a practicar las habilidades que más quieren aprender, pero pueden ser difíciles de evaluar: puede haber muchas maneras inesperadas de obtener la respuesta correcta, y es desmoralizante si un sistema de calificación automática rechaza el código de la solución porque no se corresponde con el del docente. Una forma de reducir qué tanto ocurre esto es evaluar solo su producción, pero eso no les da una devolución sobre cómo están programando. Otra manera es darles un pequeño conjunto de evaluación en el que pueden ejecutar su código antes de enviarlo (y entonces el código se evalúa con un conjunto más amplio de pruebas). Hacer esto les ayuda a descubrir si han malinterpretado completamente la intención del ejercicio antes de hacer cualquier cosa que pueda afectarles la nota.
En lugar de escribir código que satisface algunas especificaciones, se les puede pedir a los/las estudiantes que escriban pruebas para determinar si un fragmento de código se ajusta a una especificación. Esta habilidad es útil por sí misma y practicarla puede darles a los/las estudiantes un poco más de simpatía por el trabajo duro de sus docentes.
Completar los espacios en blanco es un refinamiento de programar y ejecutar en el que el/la estudiante recibe el comienzo de un código y debe completarlo.
Problemas de Parsons

Reorganiza e indenta estas líneas para obtener la suma de los valores positivos de una lista. (También deberás agregar dos “dos puntos” en los lugares apropiados)

total = 0
if v > 0
total += v
for v in valores
Ten en cuenta que dar a los/las estudiantes más líneas de las que necesitan, o pedirles que reordenen algunas líneas y añadan algunas más, hace que los problemas de Parsons sean significativamente más difíciles Harms, Chen, and Kelleher (2016).
Seguir
Seguir la ejecución es la inversa de un problema de Parsons: dadas unas pocas líneas de código, los/las estudiantes tienen que rastrear el orden en que se ejecutan esas líneas.
Esta es una habilidad esencial de depuración y una buena manera de consolidar la comprensión de los/las estudiantes de los bucles, los condicionales y el orden de evaluación de las llamadas a funciones y métodos.
requerir que los/las estudiantes rastreen el código hacia atrás para averiguar cuál debe haber sido la entrada para que el código produzca un resultado determinado Armoni and Ginat (2008).
Estos problemas de ejecución inversa requieren razonamientos de búsqueda y deducción, y cuando la salida es un mensaje de error, contribuyen a que los/las estudiantes desarrollen habilidades valiosas de depuración.
13.2.3 Ejecución inversa

Rellena el número faltante en valores que causó que esta función se interrumpiera.

valores = [ [1.0, -0.5], [3.0, 1.5], [2.5, ___] ]
corridaTotal = 0.0
for (lectura, escalada) in valores:
    corridaTotal += lectura / escalada
Diagramas
Hacer que los estudiantes dibujen mapas conceptuales y otros diagramas brinda una idea de cómo están pensando (Section 4.1), pero los diagramas de forma libre requieren que una persona los evalúe (no pueden ser calificados automáticamente), por lo que consumen mucho tiempo.
Etiquetar los diagramas, por otra parte, es casi tan potente pedagógicamente pero mucho más fácil de escalar. En lugar de hacer que tus estudiantes creen diagramas desde cero, puedes entregarles un diagrama y un conjunto de etiquetas y hacer que coloquen las etiquetas en los lugares correctos. El diagrama puede ser una estructura de datos (“después de ejecutar este código, ¿qué variables apuntan a qué partes de esta estructura?”), un gráfico (“une con flechas cada uno de estos fragmentos de código con la parte del gráfico generado”), o el propio código (“haz coincidir cada término con un ejemplo de ese mismo elemento en el programa”).
Revisión de código
Marca los problemas en cada línea de código usando la rúbrica proporcionada.
-
def addem(f):
-
x1 = open(f).readlines() -
x2 = [x for x in x1 if x.strip()] -
changes = 0 -
for v in x2: -
print('total', total) -
tot = tot + int(v) -
print('total')nombre de la variable incorrecto uso de variable indefinida falta el valor de salida variable no usada
14 Construyendo una comunidad de práctica
El aprendizaje situado se centra en la transición entre ser una persona recién llegada hasta la aceptación como colega por quienes ya son parte de la comunidad.
Resolución de problemas:
“No puedo avanzar — ¿podemos trabajar en el diseño de esta lección conjuntamente?”
Pedidos de información:
“¿Cuál es la contraseña para administrar la lista de correo?”
Búsqueda de experiencia:
“¿Alguien ha tenido una/un estudiante con discapacidad para leer?”
Compartir recursos:
“El año pasado armé un sitio web para una clase que puedes usar como punto de partida”.
Coordinación:
“¿Podemos combinar nuestros pedidos de camisetas para obtener un descuento?”
Construir un argumento:
“Será más fácil convencer a mi jefe de que haga cambios si sé cómo hacen esto en otros talleres”.
Documentar proyectos:
“Ya hemos tenido este problema cinco veces. Vamos a escribirlo de una vez por todas”.
Mapeo de conocimientos:
“¿Qué otros grupos están haciendo algo similar en vecindarios o ciudades cercanas?”
Visitas:
“¿Podemos visitar su programa extracurricular? Necesitamos establecer uno en nuestra ciudad”.
[En términos generales][community-types], una comunidad de práctica puede ser:
Comunidad de acción:
personas enfocadas en un objetivo compartido, como conseguir que un candidato sea elegido.
Comunidad de cuidado:
en la que las personas integrantes de la comunidad se unen alrededor de un problema compartido, como tratar una enfermedad a largo plazo.
Comunidad de interés:
enfocada en el amor compartido por algo, por ejemplo el backgammon o tejer.
Comunidad de lugar:
personas que viven o trabajan juntas.
15 Tipos de Eventos
Club de Lectura
16.1 Marketing
tus propuestas de proyectos para solicitar subsidios;

las personas que terminan exitosamente tus talleres a las que las empresas que te patrocinaron les gustaría contratar;

el resumen de media página de tus talleres que quien gobierna incluye en el balance o resumen anual presentado al concejo deliberante, que muestra cómo apoya al sector tecnológico local; o

la satisfacción personal que obtienen los/las voluntarios/as cuando enseñan.
quien insatisfacción con lo que está disponible actualmente nuestros/as categoría proveen beneficio clave A diferencia de alternativas nuestro programa característica distintiva clave.
En el ejemplo del taller de fin de semana, podríamos usar este tono para los/las participantes
Para personas que regresan a la actividad laboral después de estar inactivas por varios años
quienes tienen todavía responsabilidades familiares,
nuestros talleres introductorios de programación
proveen clases los fines de semana con guardería incluida.
A diferencia de las clases en línea,
nuestro programa le da a la gente la oportunidad de conocer a otras personas en la misma etapa de la vida.
y este otro discurso de presentación para quienes toman decisiones en las empresas que podrían patrocinar los talleres:
Para empresas que quieren reclutar desarrolladores/as de software de nivel básico
quienes tienen dificultades para encontrar candidatos/as con suficiente madurez en diversas formaciones
nuestros talleres introductorios de programación
proveen potenciales candidatos/as.
A diferencia de una feria de reclutamiento universitario,
nuestro programa conecta empresas con una gran variedad de candidatos/as.
Mitos fundacionales
Una de las historias más convincentes que una persona o grupo puede contar es por qué y cómo comenzaron. ¿Estás enseñando algo que desearías que alguien te hubiera enseñado pero no lo hizo? ¿Había una persona en particular a la que querías ayudar y eso abrió las puertas?
Si no hay una sección en tu sitio web que comience con “Había una vez”, piensa en agregar una.
Hola NOMBRE

Espero que no te resulte inoportuno recibir este correo, pero quería continuar con nuestra conversación en LUGAR DE REUNIÓN para ver si tendrías interés en que realicemos un taller de entrenamiento para docentes—estamos programando la próxima tanda para las próximas dos semanas.

Este taller de un día les enseñará a tus voluntarios/as una serie de prácticas de enseñanza útiles y basadas en evidencias. El taller se ha impartido más de cien veces de diversas maneras en los seis continentes para organizaciones sin fines de lucro, bibliotecas y empresas, y todo el material está disponible gratuitamente en línea en http://teachtogether.tech.

El temario incluye:

    estudiantes tipo

    diferencias entre diferentes tipos de estudiantes

    uso de evaluaciones formativas para diagnosticar malentendidos

    la enseñanza como un arte performativo

    que motiva y desmotiva a estudiantes adultos/as

    la importancia de la inclusión y como ser un buen aliado/a

Si esto te resulta interesante, por favor avísame—Agradecería la oportunidad de hablar de los modos y por qué medios sería adecuado hacerlo.

Gracias,

NOMBRE
Referencias
Construir alianzas con otros grupos que hacen cosas relacionadas a tu trabajo vale la pena por muchas razones. Una de ellas son las referencias: si la persona que se aproxima en busca de tu ayuda podría ser mejor atendida por alguna otra organización, tómate un momento para presentarlos. Si ya has hecho esto varias veces, agrega información a tu sitio web para ayudar a la próxima persona a encontrar lo que necesita. En retribución, las organizaciones a las que estás ayudando pronto empezarán a ayudarte.
17.3 Como determinar cuanto cobrar / Negociando el pago
Calcular el precio (por hora)
un primer paso es asignar un precio a la hora de trabajo. Los colegios profesionales y los gremios suelen brindar listados de precios por hora para las tareas de sus profesionales, muchas veces están publicados en sus sitios web. Otra fuente puede ser el valor por hora de un docente de nivel superior (universitario/terciario), al cual se debe multiplicar por 2.5 o 3 para obtener un precio que contemple los costos que tiene trabajar de forma autónoma (Gunderloy2009?). También podes consultar con colegas qué precio por hora cobran y analizar el precio promedio en las publicaciones y ofertas de cursos similares a los tuyos. En 2021 se lanzó 500 Women Scientists’ Fix The Gap initiative para generar una base de datos pública con una lista de honorarios por dar charlas en CTIM (Ciencia, Tecnología, Ingeniería y Matemáticas), aunque la mayoría de los datos se concentra en el norte global es una buena fuente de consulta.
Determinar una tarifa base
enseñar un curso no es solo ir en la fecha acordada, pararse delente de la clase y empezar a enseñar. La preparación del material corresponde a un porcentaje importante del tiempo invertido en el curso. En general los clientes no van a aceptar pagarte ese tiempo, por lo que incorporarlo en el costo del curso es una forma de cobrar por esa tarea. Una hora de curso corresponde entre una y tres horas de preparación. Esta relación puede cambiar si el curso es totalmente nuevo o ya tienes algo de material preparado. Por ejemplo, podrías iniciar con una tarifa base de dos horas adicional de costo por cada hora frente a estudiantes.
Más pedidos, más costo
A esa tarifa de base se le pueden agregar más horas de acuerdo a los pedidos del cliente. Agregar entre una a tres horas en el costo para la personalización del material (ejemplos, ejercicios, desafíos o ejercitación extra) utilizando datos relacionados con su actividad. También añadir entre dos a cuatro horas de costo extra si solicitan grabar la clase para uso futuro o para publicarla. No aceptes agregás “una cosa más” sin confirmar primero que vas a vas a cobrar por el trabajo. Si lo que estás enseñando es especializado o avanzado y requiere una preparación extra (por ejemplo, incorporar las APIs de la empresa en el material del curso sobre como usar R para análisis de datos) o contar con conocimientos avanzados y actualizados puedes agregar entre dos a cuatro horas al costo total.
Enseñando en equipo
Ya hemos mencionado que es mejor si enseñamos con otras personas. Ya sea porque siempre enseñas en equipo, por que por el numero de estudiantes que va a tener tu curso necesitas ayuda, debes agregar al costo las horas de clase de quienes enseñaran contigo. Si el curso es presencial también se agregan los costos de viaje y alojamiento, tanto tuyo como de tus co-docentes y ayudantes.
Ultimos ajustes
puede ser que no quieras tener la misma tarifa para una universidad pública que para una empresa; para una organización sin fines de lucro que para un banco o compañía de seguros. Puedes tener un valor de la hora diferente para diferente tipos de organizaciones. También puedes ofrecer tus servicios de forma gratuita o acordar un precio diferente si donan tu pago a una organización que desees ayudar. Finalmente, no trabajes barato con la esperanza de que la capacitación te lleve a un trabajo de consultoría: ocurre, pero es muy infrecuente como para apostar por ello.
18 ¿Por qué enseñamos? Hoy soy menos optimista que entonces. Cambio climático, extinción masiva, capitalismo de vigilancia, desigualdad a una escala que no habíamos visto desde hace un siglo, el resurgimiento del nacionalismo racista: mi generación vio cómo sucedió todo esto y se quedó de brazos cruzados. La factura de nuestra cobardía, letargo y avaricia no se pagará hasta que mi hija crezca, pero llegará, y para cuando lo haga, no habrá soluciones fáciles para estos problemas (y posiblemente no haya soluciones en absoluto).
Así que por eso enseño: estoy enojado. Estoy enojado porque tu género, el color de tu piel y la riqueza y conexiones de tu madre y de tu padre no deberían contar más que cuán inteligente, honesta/o o trabajadora/or seas. Estoy enojado porque convertimos a internet en una cloaca. Estoy enojado porque los nazis están en marcha una vez más y los multimillonarios juegan con cohetes espaciales mientras el planeta se derrite. Estoy enojado, entonces enseño, porque el mundo solo mejora cuando enseñamos a las personas cómo mejorarlo.
En su ensayo de 1947 [“¿Por qué escribo?”][por-que-escribo], George Orwell escribióEn el link encuentras el texto completo en castellano. El fragmento que sigue es una traducción propia del original en inglés.:
En una época pacífica, podría haber escrito libros superficiales, decorativos o simplemente descriptivos, y podría haber permanecido casi inconsciente de mis lealtades políticas. Pero tal como están las cosas, me he visto obligado a convertirme en una especie de panfletista… Cada línea de trabajo serio que he escrito desde 1936 ha sido escrita, directa o indirectamente, en contra del totalitarismo… Me parece una tontería, en un período como el nuestro, pensar que uno puede evitar escribir sobre tales temas. Todas las personas escriben al respecto de una manera u otra. La cuestión es simplemente elegir de qué lado lo hacemos.
Reemplaza “escribir” por “enseñar” y sabrás porqué hago lo que hago.
Enseño porque la educación puede transformar vidas… sin duda transformó la mía. Se trata de ayudar a adquirir el poder de cambiar nuestras vidas y las de quienes nos rodean. Se trata de ayudar a adquirir un poder que nadie puede arrebatarte una vez que lo tienes. Un poder que se multiplica cuanto más lo usas, cuanto más lo compartes.
20 Código de conducta
Con el objetivo de fomentar un ambiente abierto y amigable, las personas encargadas del proyecto, colaboradoras/es y personas de soporte, nos comprometemos a hacer de la participación en nuestro proyecto y en nuestra comunidad una experiencia libre de acoso para todas/os, independientemente de su edad, tamaño corporal, discapacidad, etnia, identidad y expresión de género, nivel de experiencia, educación, nivel socioeconómico, nacionalidad, apariencia personal, raza, religión o identidad y orientación sexual. 20.1 Nuestros estándares
Ejemplos de comportamientos que contribuyen a crear un ambiente positivo para nuestra comunidad:
utilizar un lenguaje amigable e inclusivo,

respetar diferentes puntos de vista y experiencias,

aceptar adecuadamente la crítica constructiva,

enfocarse en lo que es mejor para la comunidad y

mostrar empatía hacia otras/os participantes de la comunidad.
Ejemplos de comportamiento inaceptable:
el uso de lenguaje o imágenes sexualizadas así como dar atención o generar avances sexuales no deseados,

ofender o provocar de modo malintencionado (trolling), comentarios despectivos, insultantes y ataques personales o políticos,

acoso público o privado,

publicar información privada de otras personas, tales como direcciones físicas o de correo electrónico, sin su permiso explícito, y

otras conductas que puedan ser razonablemente consideradas como inapropiadas en un entorno profesional.
Aplicación
Los casos de comportamiento abusivo, acosador o inaceptable pueden ser denunciados enviando un correo electrónico a las personas encargadas del proyecto a la dirección [email protected] (en inglés) y [email protected] (en español). Todas las quejas serán revisadas e investigadas y darán como resultado una respuesta que se considere necesaria y apropiada a las circunstancias. El equipo encargado del proyecto está obligado a mantener la confidencialidad de quien reporte un incidente. Se pueden publicar por separado más detalles de políticas de aplicación específicas.
Aquellas personas encargadas del proyecto que no cumplan o apliquen este código de conducta de buena fe pueden enfrentar repercusiones temporales o permanentes determinadas por el resto del equipo a cargo del proyecto.
21 Unirse a nuestra comunidad
Enseñando a evaluar
Esta rúbrica fue diseñada para evaluar lo que se enseñó durante 5 a 10 minutos con diapositivas, programación en vivo o una combinación de ambas estrategias. Valora cada ítem como “Sí,” “Más o menos,” “No,” o “No corresponde (NC).” Inicio Presente (usa NC para otras las respuestas si no hay un inicio) Adecuada duración (10 a 30 segundos) Se presenta Presenta el tema que se trabajará Describe los requisitos Contenido Objetivos claros/narrativa fluida Lenguaje inclusivo Ejemplos y tareas reales Enseña buenas prácticas/utiliza código idiomático Señala un camino intermedio entre la Escila de la jerga y la Caribdis de la sobresimplificación Dando la lección Voz clara y entendible (usa “Más o menos” o “No” para acentos muy marcados) Ritmo: ni muy rápido ni muy lento, no realiza pausas largas o se interrumpe, no aparenta estar leyendo sus notas Seguridad: no se pierde en el pozo de alquitrán de la incertidumbre ni tampoco en las colinas de estiércol de la condescendencia Diapositivas Usa diapositivas (completa con NC el resto de las respuestas si no usa diapositivas) Diapositivas y discurso se complementan uno al otro (programación dual) Fuentes y colores legibles; sin bloques de texto abrumadores por su tamaño Pantalla: cambia frecuentemente (algo cambia cada 30 segundos) Adecuado uso de figuras Programación en vivo Usa programación en vivo (completa con NC el resto de las respuestas si no usa programación en vivo) Código y discurso se complementan uno al otro Fuentes y colores legibles; adecuada cantidad de código en pantalla Uso de herramientas de forma adecuada Resalta elementos clave del código Analiza los errores Cierre Presente (valora NC para otras respuestas si el cierre no está presente) Adecuada duración (10 a 30 segundos) Resume puntos clave Presenta un esquema general de los próximos pasos En general Puntos claramente conectados y flujo lógico Hace que el tema sea interesante (es decir, no aburrido) Comprende el tema
24.2 Evaluación del grupo docente
Esta rúbrica fue diseñada para evaluar el desempeño de individuos dentro de un grupo. Los ejemplos a continuación pueden servirte como material inicial a partir del cual desarrollar tus propias rúbricas. Valora cada ítem como “Sí,” “Más o menos,” “No,” o “No corresponde (NC).” Comunicación Escucha atentamente y sin interrumpir Aclara lo que se ha dicho para garantizar la comprensión Articula ideas en forma clara y concisa Argumenta adecuadamente sus ideas Obtiene el apoyo de otras/os integrantes del equipo Toma de decisiones Analiza los problemas desde diferentes puntos de vista Aplica lógica para resolver problemas Propone soluciones basadas en hechos y no en “corazonadas” o intuición Invita al resto del equipo a proponer nuevas ideas Genera nuevas ideas Acepta cambios Colaboración Reconoce los problemas que el equipo necesita enfrentar y resolver Trabaja para hallar soluciones que sean aceptables para todas las partes involucradas Comparte el crédito del éxito con otras/os integrantes del equipo Promueve la participación entre todos las/los integrantes del equipo Acepta la crítica abiertamente y sin “ponerse a la defensiva” Coopera con el equipo Autogestión Monitorea sus avances para garantizar que se alcancen los objetivos Le da máxima prioridad a obtener resultados Define tareas prioritarias para los encuentros de trabajo Promueve que otras/os integrantes del equipo manifiesten sus opiniones, incluso si no coinciden con las propias Mantiene la atención durante la reunión Usa eficientemente el tiempo de reunión Sugiere formas de trabajar en las reuniones
24.5 Diseño de lecciones diseño de lecciones por el método de reingeniería, que fue desarrollado independientemente por Wiggins and McTighe (2005), Biggs and Tang (2011), Fink (2013).
24.5.1 ¿Para quién es esta lección?
Crea algunas personas tipo (Section 7.1) o (mejor aún) elige entre los que tú y tus colegas han creado para uso general. Cada estudiante tipo debe tener:
un contexto general,

lo que ya sabe,

lo que cree que quiere saber y

qué necesidades especiales tiene.
Ejercicio breve: resumen breve de a quién estás intentando ayudar. 24.5.2 ¿Cuál es la idea principal?
Responde tres o cuatro de las siguientes preguntas sólo enumerando elementos para ayudarte a descifrar el enfoque de la lección. No necesitas responder todas las preguntas, y puedes plantear y responder otras preguntas si crees que ayudarán, pero debes incluir sí o sí un par de respuestas a la primera pregunta. Además, en esta etapa puedes crear un mapa conceptual (Section 4.1).
¿Qué problemas aprenderán a resolver?

¿Cuáles conceptos y técnicas aprenderán?

¿Cuáles herramientas tecnológicas, paquetes y funciones usarán?

¿Qué términos de jerga definirás?

¿Qué analogías usarás para explicar conceptos?

¿Qué errores o conceptos erróneos esperas encontrar?

¿Qué conjuntos de datos utilizarás?
Ejercicio breve enfoque general y sin detalles de la lección. Compártelo con una/un colega — una breve devolución en esta instancia puede ahorrar horas de esfuerzo más tarde. 24.5.3 ¿Qué harán tus estudiantes durante la lección?
Establece los objetivos del paso 2 escribiendo descripciones detalladas de algunos ejercicios que tus estudiantes serán capaces de resolver al final de la lección. Hacer esto es análogo al [desarrollo impulsado por pruebas][test-driven-development-es]: en vez de trabajar en función de un conjunto de objetivos de aprendizaje (probablemente ambiguos), hazlo “hacia atrás”: elabora ejemplos concretos que quieres que puedan resolver tus estudiantes. Esto además permite dejar en evidencia requisitos técnicos necesarios que de otro modo podrían no descubrirse hasta que fuera demasiado tarde.
Para complementar la descripción detallada de los ejercicios, escribe la descripción de uno o dos ejercicios para cada hora de lección como una lista de conceptos breve. De este modo, puedes visualizar qué tan rápido esperas que tus estudiantes avancen. De nuevo, esto permitirá tener una visión realista sobre lo que asumiste de tus estudiantes y ayudará a hacer evidentes los requisitos técnicos necesarios para resolver el ejercicio. Una manera de elaborar estos ejercicios adicionales es hacer una lista con las habilidades que necesitan para resolver los ejercicios principales y crear un ejercicio que aborde cada una.
Ejercicio breve: 1 a 2 ejercicios explicados de principio a fin que usen las habilidades que tus estudiantes van a aprender, y una media docena de ejercicios con su solución esquematizada. Incluye soluciones completas para que puedas asegurarte de que el programa que usen funciona. 24.5.4 ¿Cómo están conectados los conceptos
Coloca los ejercicios que creaste en un orden lógico y a partir de ellos deriva el esquema general de una lección. El esquema debe tener entre 3 a 4 ítems por hora de clase con una evaluación formativa para cada uno. En esta etapa es común que modifiques las evaluaciones de forma que puedan basarse sobre las anteriores.
Ejercicio breve: el esquema de una lección. Es muy probable que te encuentres con que te habías olvidado de algunos elementos y que no están incluidos en tu trabajo hasta aquí, así que no te sorprendas si debes ir y venir varias veces. 24.5.5 Descripción general de la lección
Ahora puedes escribir la descripción general de la lección que incluya:
un párrafo de descripción (es decir, un discurso de venta para tus estudiantes),

media docena de objetivos de aprendizaje y

un resumen de los requisitos.
Hacer esto antes suele ser un esfuerzo inútil ya que el material que compone la lección aumenta, se recorta o cambia de lugar en las etapas anteriores.
Ejercicio breve: descripción del curso, objetivos de aprendizaje y requisitos. 24.6 Cuestionario de pre-evaluación
Este cuestionario ayuda a las/los docentes a estimar el conocimiento previo sobre programación de las/los participantes en un taller introductorio a JavaScript. Las preguntas y respuestas son concretas y el cuestionario es corto, para que no resulte intimidante.
¿Cuál de estas opciones describe mejor tu experiencia con la programación en general?

    No tengo ninguna experiencia.

    He escrito unas pocas líneas de código alguna vez.

    He escrito programas para uso personal de un par de páginas de extensión.

    He escrito y mantenido porciones grandes de programas.

¿Cuál de estas opciones describe mejor tu experiencia con la programación en JavaScript?

    No tengo ninguna experiencia.

    He escrito unas pocas líneas de código alguna vez.

    He escrito programas para uso personal de un par de páginas de extensión.

    He escrito y mantenido porciones grandes de programas.

¿Cuál de estas opciones describe mejor cuán fácil te resultaría escribir un programa en el lenguaje de programación que prefieras para hallar el número más alto en una lista?

    No sabría por dónde comenzar.

    Podría resolverlo con prueba y error y realizando bastantes búsquedas en internet.

    Lo resolvería rápido con poco o nada de ayuda externa.

¿Cuál de estas opciones describe mejor cuán fácil te resultaría escribir un programa en JavaScript para hallar y cambiar a mayúscula todos los títulos de una página web?

    No sabría por dónde comenzar.

    Podría resolverlo con prueba y error y realizando bastantes búsquedas en internet.

    Lo resolvería rápido con poco o nada de ayuda externa.

¿Qué te gustaría saber o poder hacer al finalizar esta clase que no sabes o puedes hacer ahora?
24.7 Organizando un curso o taller
Esta lista de plantillas y checklist pueden ser útiles para diferentes etapas del proceso de organizar un curso. 24.7.1 Formuario de registro
El formulario de registro o demostración de interés te permite recabar información sobre tus estudiantes, siempre es conveniente conocer a tu audiencia. Las necesidades de información pueden variar de acuerdo el contexto o el tipo de curso que vayas a dictar. En este ejemplo recabamos información sobre
Pronombres
Geografía y lenguaje
Datos profesionales
Herramientas
Accesibilidad
Mantener contacto
24.7.1.1 Requisitos legales de protección y uso de datos personales
Debes tener en cuenta que vas a tener que cumplir con requisitos de almacenamiento y procesamiento de información personal de las personas que se inscriban a tus cursos y completen estos formularios. Para este punto es importante aclarar al inicio del formulario o en el texto donde se solicita que las personas se inscriban una serie de detalles:
para qué se usará la información (Ej: para acomodar la infraestructura del taller de acuerdo a tus necesidades de accesibilidad)
quién tiene acceso a esa información sin procesar (Ej: el personal contratado de la organización) y procesada (Ej: el equipo docente de una edición del curso).
dónde y cómo se almacena (Ej: en la base de datos de la universidad que hace de anfitrión del curso)
explicar un proceso para que quien quiera borrar o modificar los datos pueda hacerlo.
explicar que completando el formulario dan consentimiento a este uso de los datos.
24.7.1.2 Preguntas del formulario
Sección Datos generales:
    mail (utilizado para contacto y como identificador único),
    Nombre completo (es mejor que solicitar nombre y apellido por separado),
    pronombres (para dirigirnos a cada persona correctamente),
    país desde el cual participa (es un dato útil para conocer tu alcance).

Sección Datos profesionales:
    Nivel educativo completo
    ¿cuántos años hace que diste tu primera clase?,
    Ámbito educativo en el que enseña la mayor parte del tiempo,
    Tipo de institución en donde enseña la mayor parte del tiempo,
    Cantidad de estudiantes esperas en tu próxima clase y
    Qué disciplina/s enseñas.

Sección de Herramientas: uso y accesibilidad:

conocimientos de Español (porque es el idioma en el cual dictamos nuestros cursos),

la experiencia en el uso de Formularios de Google, Documentos de Google, Slack y Zoom (porque son las herramientas que usamos para enseñar y para interactuar, tanto en los cursos como en la comunidad),

dificultades para participar de talleres en forma remota:
    Tengo dificultad para ver, aun con anteojos o lentes de contacto
    Tengo dificultad para oír, aun con audífono
    Tengo dificultades de movilidad que afectan mi interacción con dispositivos electrónicos como el celular o computadora
    Tengo dificultad para permanecer delante de una pantalla más de 50 minutos
    Tengo dificultad para comprender o recordar
    Tengo dificultad para concentrarme
    Tengo dificultad para comunicarme
    No tengo ninguna de estas dificultades
    No tengo ninguna de estas dificultades

Si la persona marcó que tiene alguna dificultad, se le pregunta ¿cómo podemos facilitar tu participación?
    No tengo ninguna dificultad
    Con un lector de pantalla
    Con materiales con alto contraste y letra grande
    Usando comunicación por voz
    Hablando claro, pausado, con buena calidad de audio
    Con subtitulado
    Usando lengua de señas
    Usando comunicación por escrito
    Con pausas frecuentes lejos de la pantalla
    Prefiero no decirlo

¿Tienes alguna de las siguientes dificultades tecnológicas para participar de talleres en forma remota?
    Tengo una conexión a internet inestable o limitada
    No tengo internet
    No tengo computadora, tablet, teléfono móvil, ni ningún otro dispoisitivo con el cual conectarme a internet
    Tengo dispositivos para conectarme a internet, pero no andan bien
    No tengo micrófono
    No tengo ninguna de estas dificultades
    Prefiero no decirlo

Si la persona marcó que tiene alguna dificultad tecnológica se le pregunta, ¿cómo podemos facilitar tu participación?
    No tengo ninguna dificultad
    Facilitando un número de teléfono como opción a conectar por internet
    Permitiendo participar por escrito
    Permitiendo participar usando la voz
    Prefiero no decirlo
Se pide permiso para enviarle información por mail sobre otros cursos y otras noticias de MetaDocencia.
Finalmente se agrega una pregunta abierta, dando la posibilidad que la persona comparta otra información que considere pertienente.
En nuestro centro de recursos puedes acceder a una versión editable que te recomendamos duplicar para poder trabajarla sin problemas para tus propios objetivos.
24.7.2 Formulario de Feedback
Este formulario se comparte al finalizar el taller y tiene como objetivo identificar areas de mejora en el contenido y la dinámica del curso.
Aquí puedes acceder a una versión editable que te recomendamos duplicar para poder trabajarla sin problemas para tus propios objetivos.
24.8 Documentos compartido
Durante nuestros cursos utilizamos un documento compartido para tomar notas y resolver ejercicios juntos. Es una forma de elaboración en tiempo real que obliga a reflexionar sobre el material a medida que se lo presenta. Los ejercicios en conjunto son una muy buena opción de evaluación formativa.
Aquí puedes acceder a una plantilla de un documento compartido que te recomendamos duplicar para poder trabajarla sin problemas para tus propios objetivos. 24.9 Comunicación con estudiantes 24.9.1 Email pre curso
Este es un texto de ejemplo del mail que se envia a los estudiantes antes de iniciar el curso
Asunto: [Tutorial de learnr] - Información para conectarte
Hola!
Muchas gracias por registrarte en el curso {nombre del curso} el {fecha del curso} a las {horario del curso} (Zona horaria UTC-3) organizado por {nombre de las instituciones y comunidades que organizan el curso}. Este mensaje tiene información importante para ayudar a prepararte para el curso. Leelo detenidamente y avisanos si tenés alguna pregunta.
Al participar de nuestros cursos aceptás este Código de Conducta.
Para esta capacitación en línea necesitás una computadora con conexión a internet, parlantes y micrófono (o auriculares con micrófono o combinación similar). No hace falta que tengas cámara, aunque si la tenés, podés usarla.
Necesitamos que tengas instalado {lista de software necesaria}
Para el curso, vamos a usar la plataforma de videoconferencia Zoom. No es necesario tener un usuario, pero es posible que tengas que instalar algo la primera vez que lo uses. Si nunca usaste Zoom o no sabés si te va a andar esta vez, por favor, hacé clic en https://zoom.us/test para hacer una llamada de prueba y seguir las instrucciones para descargar lo necesario.
Comenzaremos puntualmente. Diez minutos antes de la hora de comienzo, usá el siguiente enlace de zoom (no requiere palabra clave).
Ubicación:
Este enlace sólo será válido para este curso. Por favor, para hacer de nuestra reunión un espacio seguro, no compartas este enlace con nadie.
También por la seguridad de la reunión, es muy importante que ingreses con un nombre similar al que usaste cuando te pre-inscribiste. Tu ingreso será más rápido si lo hacés así y no tenemos que hacerte esperar hasta chequear tu identidad.
Si llegás luego de la hora de comienzo, tendrás que esperar a que autoricemos tu ingreso. Lo haremos lo antes que podamos sin interrumpir el curso en marcha.
Por último, nos gusta enseñar en ambientes amigables y distendidos. Por ejemplo, si tu familia humana o animal se asoma a saludar, será bienvenida. Tené el mate a mano o lo que quieras tomar o comer durante el curso. También habrá pausas si te olvidás algo o necesitás hacer alguna escala técnica.
Si tenés alguna pregunta sobre el taller, la modalidad, o cualquier otra cosa, no dudes en ponerte en contacto.
¡Nos vemos en el curso!
{nombre del equipo docente} en nombre del equipo de {nombre de las instituciones/comunidades que organizan el curso}. 24.9.2 Email pos curso
Este es un texto de ejemplo del mail que se envia a los estudiantes despues que termina el curso
Asunto: {nombre del curso}
Texto:
¡Hola y gracias por participar del curso hoy!
En este mail encontrarás algunos links que pueden ser de tu interés:
Link al documento compartido que utilizamos hoy:

Link a un video de este curso (por si te perdiste alguna parte o querés volver a verlo):

Link a las slides utilizadas en el curso:
Recorda que podés encontrarnos en los siguientes medios:
Web:
Mail:
Nuestro Slack: ¡Sumate!
YouTube:
Facebook:
Mastodon:
Por último, si aún no lo hiciste, te agradecemos que puedas completar nuestra encuesta de fin de curso. Nos ayuda mucho a seguir mejorando,
¡Gracias!
Saludos, y hasta el próximo curso. 24.9.3 Formulario de feedback despues de un tiempo de tomar la capacitación Aveling, Emma-Louise, Peter McCulloch, and Mary Dixon-Woods. 2013. “A Qualitative Study Comparing Experiences of the Surgical Safety Checklist in Hospitals in High-Income and Low-Income Countries.” BMJ Open 3 (8). https://doi.org/10.1136/bmjopen-2013-003039. Biggs, John, and Catherine Tang. 2011. Teaching for Quality Learning at University. Open University Press. Fink, L. Dee. 2013. Creating Significant Learning Experiences: An Integrated Approach to Designing College Courses. Jossey-Bass. Gawande, Atul. 2007. “The Checklist.” The New Yorker, December. Ramsay, G., A. B. Haynes, S. R. Lipsitz, I. Solsky, J. Leitch, A. A. Gawande, and M. Kumar. 2019. “Reducing Surgical Mortality in Scotland by Use of the WHO Surgical Safety Checklist.” BJS, April. https://doi.org/10.1002/bjs.11151. Urbach, David R., Anand Govindarajan, Refik Saskin, Andrew S. Wilton, and Nancy N. Baxter. 2014. “Introduction of Surgical Safety Checklists in Ontario, Canada.” New England Journal of Medicine 370 (11): 1029–38. https://doi.org/10.1056/nejmsa1308261. Wiggins, Grant, and Jay McTighe. 2005. Understanding by Design. Association for Supervision & Curriculum Development (ASCD).
https://www.nature.com/articles/d41586-024-00725-1
WebAssembly (or Wasm) instruction format, allowing it to run in a software-based environment inside a browser. No external servers are required
All modern browsers support WebAssembly, so code that works on one computer should produce the same result on any other.
no installation is needed,
Statistician Eric Nantz at pharmaceuticals company Eli Lilly in Indianapolis, Indiana, is part of a pilot project to use webR to share clinical-trial data with the US Food and Drug Administration — a process that would otherwise require each scientist to install custom computational dashboards.
Aboukhalil has created a series of tutorials at sandbox.bio, with which users can test-drive bioinformatics tools in an in-browser text console.
Common functions https://tinystats.github.io/teacups-giraffes-and-statistics/images/04_variance/holding.png Most of the time when we work in R, we will use functions; either pre-written functions or ones we write ourselves. Functions make it easy to use sets of code instructions repeatedly (without filling our scripts with the code underlying the function) and help us carry out multiple tasks in a single step without having to go through the details of how the steps are executed.
To use functions in R, we type the name of the function followed by parentheses (e.g. print( )). Within the parentheses is where we will specify the function input and options, separated by commas ,. One function you will use a lot is the combine function c( ), which as the name suggests lets you concatenate different types of values.
In the window below, create an object combining a set of numerical values using c( ), separating the different values with commas.
Then sum up the content of this object using sum( ).
my_combined_values <- c(,) sum(my_combined_values)
Writing your own function
R makes it easy to create user defined functions by using function( ). Here is how it works:
Give your function an object name and assign the function to it, e.g. my_function_name <- function( ).
Within the parentheses you specify inputs and options just like how pre-written functions work, e.g. function(input_data)
Next, put all the code you want your function to execute inside curly brackets like this: function(input_data){code to run}
Use return( ) to specify what you want to your function to output once it is done running the code.
Use the following instructions to complete the function in the window below:
We’ve started writing a function for you that will sum up values and take the square root of the sum. To take the square root, we use the sqrt( ) function.
Complete this function by filling in input_data for the sum( ), and then filling in the remaining empty parentheses with the appropriate object names.
    Now create an object containing a set of numerical values and call it my_combined_values. Then try out your new function on this object, which will compute the square root of the object’s sum.
my_function_name <- function(input_data){ s <- sum( ) ss <- sqrt( ) return( ) }
my_combined_values <- c(,)
my_function_name(my_combined_values)
What are measures of centrality?
You’ve just collected a lot data and graphed heights. Although informative, a graphical display of these data is difficult to summarize – we need to describe these heights with a single number that will be meaningful and allow us to do statistics.
We can do this with a measure of centrality, the concept that one number in the “center” of the data set is a good summary of all the values. Below are examples of different measures of centrality.
The mean is the average and the measure of centrality that you are probably most familiar with. This is a good measure to use when the data are normally distributed. We describe it in detail below.

The median is the value in the middle of the data set. Half of the observations lie above the median and half below. When the data are normally distributed, the median and the mean will be very close to each other. When your data are not normally distributed (skewed to the left or right) the median is a more appropriate measure of centrality (see the animation below).
https://tinystats.github.io/teacups-giraffes-and-statistics/images/03_mean/median.gif
The mode is the value (height, in our case) that occurs most frequently in the data set. It’s not typically used in statistics, and we won’t cover it further here.
Taking the mean
The mean of a variable is the sum of its values, divided by the number of values.
This concept can be represented with equation below. In our case, each “x” represents a giraffe height (i.e. a single observation), and the numerical subscript indicates its order in the sample. We’ll use x¯ (read “x-bar”) to represent the mean of the height variable.
\begin{equation} (\#eq:equation1) \Large{\bar{x}} = \frac{x_1 + x_2 + ... + x_n}{n} \end{equation}\
\begin{equation} (#eq:equation2) \Large{\bar{x}} = \frac{\sum_{i=1}^{n}{x_i}}{n} \end{equation}
\
This might look intimidating, but equation @ref(eq:equation2) is really showing the same thing as @ref(eq:equation1). Let's go through the steps again, breaking the symbols apart a bit (see annotated equation @ref(eq:equation3) below). The sigma means 'add up'. What are we adding up? All the heights "x". The "i = " part indicates which term to begin with. For our purposes, this will always be the first observation, hence
\
\begin{equation} (\#eq:equation3) \vcenter{\img[width=400px]{images/03_mean/eq_annotated.png}} \end{equation}Recall our discussion about a sample versus a population. Different symbols are used to represent the mean for each of these. We've already discussed
Using @ref(eq:equation2), it's easy to translate this equation into code in R. The heights recorded from island 1 have been stored in a vector called heights_island1. Below we show the first few observations from this vector, using the head() function.
head(heights_island1)
\
Use the interactive window below to calculate the mean "by hand".
Sum up all observations stored in heights, using the sum( ) function, and save it as a new object called "heights_island1_sum"
Divide heights_island1_sum by the number of observations. Use the length( ) function for n. Store your answer as "heights_island1_mean"
Sum up all observations stored in "heights_island1", using the sum() function, and save it as a new object called "heights_island1_sum"
heights_island1_sum <- sum(heights_island1)
Divide heights_island1_sum by the number of observations. Use the length() function for n. Store your answer as "heights1_mean"
heights_island1_mean <- heights_island1_sum/length(heights_island1)
heights_island1_mean
Create your own function
Now it’s your turn to write your own function. Call it “my_mean” and have it calculate the mean of any given vector. You’re going to use the rules for writing a function in R that you’ve used previously. As a reminder, you’ll use function() and embed your code (that you completed in the window above) within curly brackets{}. The advantage of making a “homemade” function is that you can string together all the steps from the previous exercise into a single command.
my_mean <- function(vector){
}
my_mean(heights_island1) mean(heights_island1)
my_mean <- function(vector){ a <- sum(vector) b <- a/length(vector) return(b) }
my_mean(heights_island1) mean(heights_island1)
Things to think about
Remember that the sample mean is an estimate of the entire population’s mean (which would often be impossibly large to measure). How reliably does the mean of a sample represent the population mean? Warning: if a small sample has been used, the sample mean may not be a reliable at all! Estimates from small samples are subject to the whims of randomness. On the other hand, the larger the sample, the closer the sample size appraches the population size, and the more reliable the sample estimate becomes.
Pressing ‘Play’ on the plot below will illustrate this concept.
The animation above shows the values of means calculated from increasingly larger samples: small samples on the left and larger samples to the right (on the x-axis).
Each point on the zig-zag line is the mean calculated from a random sample. The true mean of the population is 0.
The y-axis shows what the mean is for a sample of that particular size. Though the y-values vary here, remember that if the sample were a good estimate of the population, the y-values should be very close to 0.
You can see that when the samples are small the sample mean isn’t necessarily a good representation of the population that it was sampled from–and that is not a good thing.
m <- list(l = 50, r = 50, b = 10, t = 10, pad = 4)

accumulate_by <- function(dat, var) {
    var <- lazyeval::f_eval(var, dat)
    lvls <- plotly:::getLevels(var)
    dats <-
      lapply(seq_along(lvls), function(x) {
        cbind(dat[var %in% lvls[seq(1, x)], ], frame = lvls[[x]])
      })
    dplyr::bind_rows(dats)
}

d <- do.call(rbind, lapply(lseq(10, 10000, 300), function(x) {
    d <- data.frame(x = rnorm(x), frame = x/300, N = x)
    return(d)
}))

dd <-
  aggregate(data = d, x ~ frame + N, FUN = mean) %>%
  accumulate_by(~N)

p <-
  dd %>%
  plot_ly(x = ~log10(N), y = ~x, frame = ~frame...4, type = "scatter", mode = "lines",
          line = list(simplyfy = F, color = "orangered"), width = 550, height = 350) %>%
  animation_opts(frame = 10, transition = 0, redraw = FALSE) %>%
  config(displayModeBar = F) %>%
  layout(xaxis = list(title = "Sample Size (log10)", zeroline = F),
         yaxis = list(range = c(-0.7, 0.7), title = "Mean", zeroline = F),
         autosize = F, margin = m) %>%
  animation_slider(hide = T) %>%
  animation_button(x = 1, xanchor = "right", y = 0, yanchor = "bottom")

htmltools::save_html(p, here("images/03_mean/Law_of_large_numbers.html"))
Spread of the Data: VARIANCE & STANDARD DEVIATION
Module learning objectives
Describe the steps for constructing the sum of squares
Describe how the standard deviations can allow us to determine which data values are common or rare
Write a function for the variance and standard deviation
Explain why the sample variance would be downwardly biased if we did not correct it by diving by (n-1)
Measures of spread
After successfully computing the mean, you return to the memory of the first day you had collected data. There was one teacup giraffe that was your favorite– it was relatively small with purple spots and perky tail! You begin to wonder how rare it would be to encounter a giraffe smaller than this one. To answer this question, you need to be able to calculate a measure of spread.
You might start by quantifying the simplest measure of spread, the range. This at least tells us the boundaries within which all the sample heights fall, but the range ignores important contextual information. For example, two data sets can have very different spreads but still have the same range. What is a more stable measurement? The answer is the variance. Variance in plain language
You need a solid understanding of variance in order to grasp the mechanics of any statistical test. But what does the concept variance really capture?
Recall the normal distribution: when we inspect the distributions below visually, we see that they all have the same mean, but some distributions are more spread out. Bell curves that are more “squished together” are composed of observations that are more similar to one another, while bell curves that are more “spread out” are composed of observations that have greater variability. Wider bell-curves mean greater variance! In plain language, the variance gives us an idea of how similar observations are to one another, and to the average value.
https://tinystats.github.io/teacups-giraffes-and-statistics/images/04_variance/bells_edited-04.png
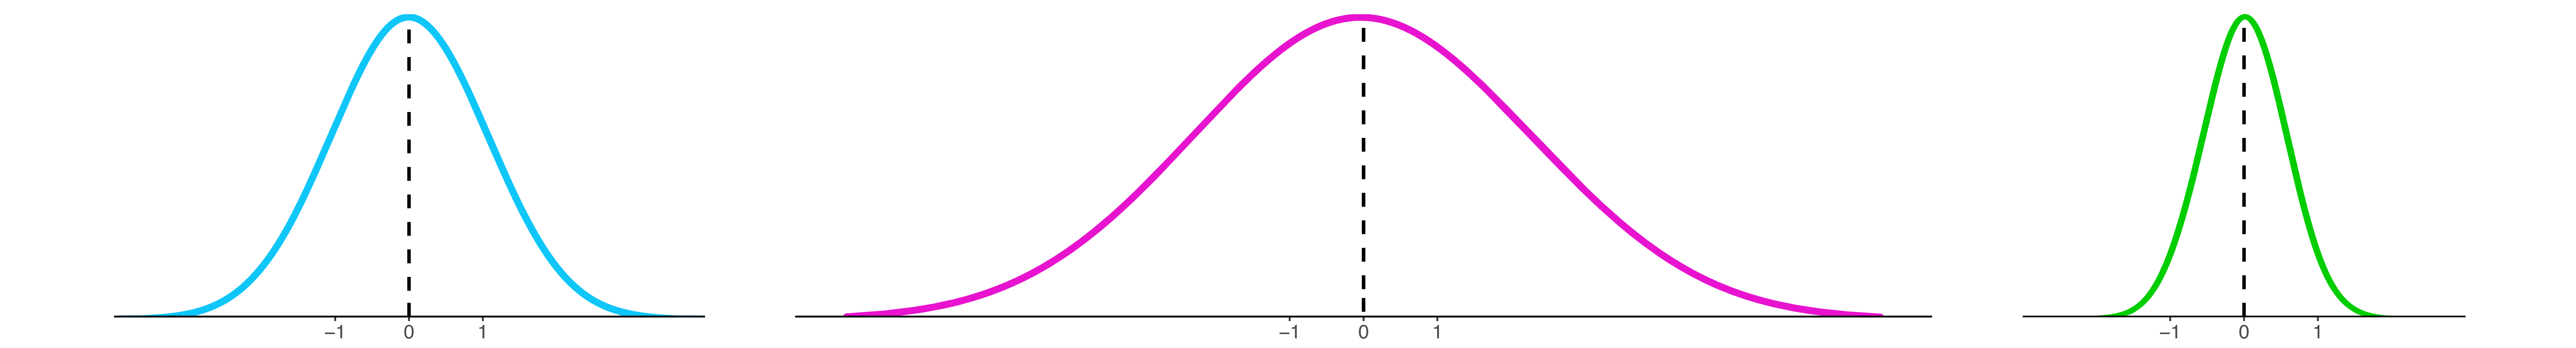
How to calculate variance
Let’s begin by going through the steps and equations for calculating the variance of a population. We’ll explain how to modify this for calculating the sample variance later on.
First, the idea is to capture how far away individual observations lie from the mean. In other words, we could subtract the mean from each observation. This is called the deviation from the mean. And since we’re calculating a population variance, we will use μ for the mean instead of x¯
.
Calculating the deviations is a great start, but we’re back to the problem of needing to summarize multiple values. Since these newly calculated values are both negative and positive, we quickly realize that adding them up (like the first step when calculating the mean) would not be a productive idea since the negatives cancel the positives.
What’s the easiest thing to do when you want to retain how far away a point is from the mean irrespective of whether it’s above or below the mean? How about taking the absolute value?
Though the absolute value of the deviation would be a valid measure of distance from the mean, it turns out that it has some mathematical properties that don’t make it the best choice, especially for more complex statistial analyses involving the variance later down the line. Why we square the deviations
There is an alternative with simpler, “better behaved” mathematical properties: squaring the deviations. Squaring will always give us positive values, so the values can never cancel each other out. It’s worth pointing out, however, that a consequence of squaring deviations will tend to amplify the influence of values at extreme distances from the mean. You can read this thread for a more detailed discussion about absolute values versus squared deviations. Sum of squares
Now we have positive, squared deviation values that can be summed to a single total. We call this total the sum of squares, and the equation is shown below.
The sum of squares is an important calculation that we will see again for other statistical operations. The animation below illustrates how these sums of squares are “constructed” starting with the sample observations and then squaring each one’s distance away from the mean.
s <- data.frame(x=c(113, 146.5, 132, 70.5, 121, 55), y=c(8.75,1.25,3.75,3.75,6.25,1.25))
s <- s[order(s$x),]
s <- s[c(1,2,3,6,5,4),]
s2 <- s
s <- s[c(1,2,6,5,4,3),]
m <- mean(s[,1])
m2 <- 85
lim <- c(0, 60)
d <- data.frame(x1=s[,1], x2=rep(m, 6), y1=s$y, y2=(abs(s[,1]-m))+s$y)
co <- c("#6FB4CE", "#D97FDA", "#DC5F24", "#C46A79", "#f93188", "#F88336")

v <- do.call(cbind, lapply(1:6, function(x) seq(d[x,]$x1, d[x,]$x2, by = (d[x,]$x2-d[x,]$x1)/29)))
vv <- lapply(1:30, function(y) data.frame(x1=v[y,], x2=d$x1, y1=s$y, y2=(abs(s[,1]-m))+s$y))

pp <- function(x){
  p1 <- ggplot()+geom_point(data=s, aes(x=x, y=y),color=co, size=4)+
    theme_light()+ylim(lim)+geom_segment(aes(x = x2, y = y1, xend = x1, yend = y1), data = x, color=co, size=2)+labs(x="Teacup giraffe height", y=NULL)+theme(panel.border=element_blank(),panel.grid.minor=element_blank(), axis.ticks=element_blank())+
    geom_segment(aes(x=m, xend=m, y=0, yend=lim[2]), linetype="dashed", color="black", size=2)+
    annotate('text', x = 111.33, y = 53, label = "bar(x)",parse = TRUE,size=15)
  p1
}

lapply(vv, function(x) pp(x))

h <- do.call(cbind, lapply(1:6, function(x) seq(d[x,]$y1, d[x,]$y2, by = (d[x,]$y2-d[x,]$y1)/29)))
hh <- lapply(1:30, function(y) data.frame(x1=s[,1], x2=rep(m, 6), y1=s$y, y2=h[y,]))

pp2 <- function(x){
  p2 <- ggplot()+geom_point(data=s, aes(x=x, y=y),color=co, size=4)+
    theme_light()+ylim(lim)+geom_segment(aes(x = x1, y = y1, xend = x2, yend = y1), data = d, color=co, size=2)+
  geom_segment(aes(x = x1, y = y2, xend = x1, yend = y1), data = x, color=co, size=2)+labs(x="Teacup giraffe height", y=NULL)+theme(panel.border=element_blank(),panel.grid.minor=element_blank(), axis.ticks=element_blank())+
    geom_segment(aes(x=m, xend=m, y=0, yend=lim[2]), linetype="dashed", color="black", size=2)+
    annotate('text', x = 111.33, y = 53, label = "bar(x)",parse = TRUE,size=15)
p2
}

lapply(hh, function(x) pp2(x))

pp22 <- function(x){
  p2 <- ggplot()+theme_light()+geom_rect(data=d, mapping=aes(xmin=x1, xmax=x2, ymin=y1, ymax=y2), color=alpha(co, x),fill=co, alpha=x/5, size=2)+ylim(lim)+geom_segment(aes(x = x1, y = y1, xend = x2, yend = y1), data = d, color=co, size=2)+
  geom_segment(aes(x = x1, y = y2, xend = x1, yend = y1), data = d, color=co, size=2)+
    geom_point(data=s, aes(x=x, y=y),color=co, size=4)+
    labs(x="Teacup giraffe height", y=NULL)+theme(panel.border=element_blank(),panel.grid.minor=element_blank(), axis.ticks=element_blank())+
    geom_segment(aes(x=m, xend=m, y=0, yend=lim[2]), linetype="dashed", color="black", size=2)+
    annotate('text', x = 111.33, y = 53, label = "bar(x)",parse = TRUE,size=15)
p2
}
lapply(seq(0,1,0.1), function(x) pp22(x))

pp3 <- function(x){
p3 <- ggplot()+theme_light()+geom_rect(data=d, mapping=aes(xmin=x1, xmax=x2, ymin=y1, ymax=y2), color=co,fill=co, alpha=0.2, size=2)+
  geom_point(data=s, aes(x=x, y=y), color=co, size=4)+
  ylim(lim)+labs(x="Teacup giraffe height", y=NULL)+theme(panel.border=element_blank(),panel.grid.minor=element_blank(), axis.ticks=element_blank())+
    geom_segment(aes(x=m, xend=m, y=0, yend=lim[2]), linetype="dashed", color="black", size=2)+
    annotate('text', x = 111.33, y = 53, label = "bar(x)",parse = TRUE,size=15)
p3
}
lapply(1:15, function(x) pp3())
Once the squares have been “constructed”, we sum their squares, producing a single value.
We need to take into account how many observations contributed to these sum of squares. So, we divide the sum of squares by N. This step essentially takes the average of the squared differences from the mean. This is the variance.
The problem with variance is that its value is not easily interpretable, the units will be squared and therefore not on the same scale as the mean. It would not be very intuitive to interpret giraffe heights written in millimeters squared! The standard deviation fixes that. We "un-square" the variance, and now we return to the data's original units (millimeters). The standard deviation equation is below:
One more thing: the equations above are for calculating the variance and standard deviation of a population. In real life applications, the population equations will almost never be used during data analysis. To calculate the variance and standard deviation for a sample instead, we will need to divide by n-1 instead of N, which we explain at the end of this module. Note that we also change to the corresponding symbols for the sample mean (
When we apply this change, our equation for the **sample variance,
And for sample standard deviation,
Since we're now focusing on samples, let's think about how we can apply the standard deviation in a useful way to normal distributions to predict how "rare" or "common" particular observations in a data set may be. For the normal distribution, almost all of the data will fall within ± 3 standard deviations from the mean. This rule of thumb, called the empirical rule, is illustrated below and you can read more about it here.

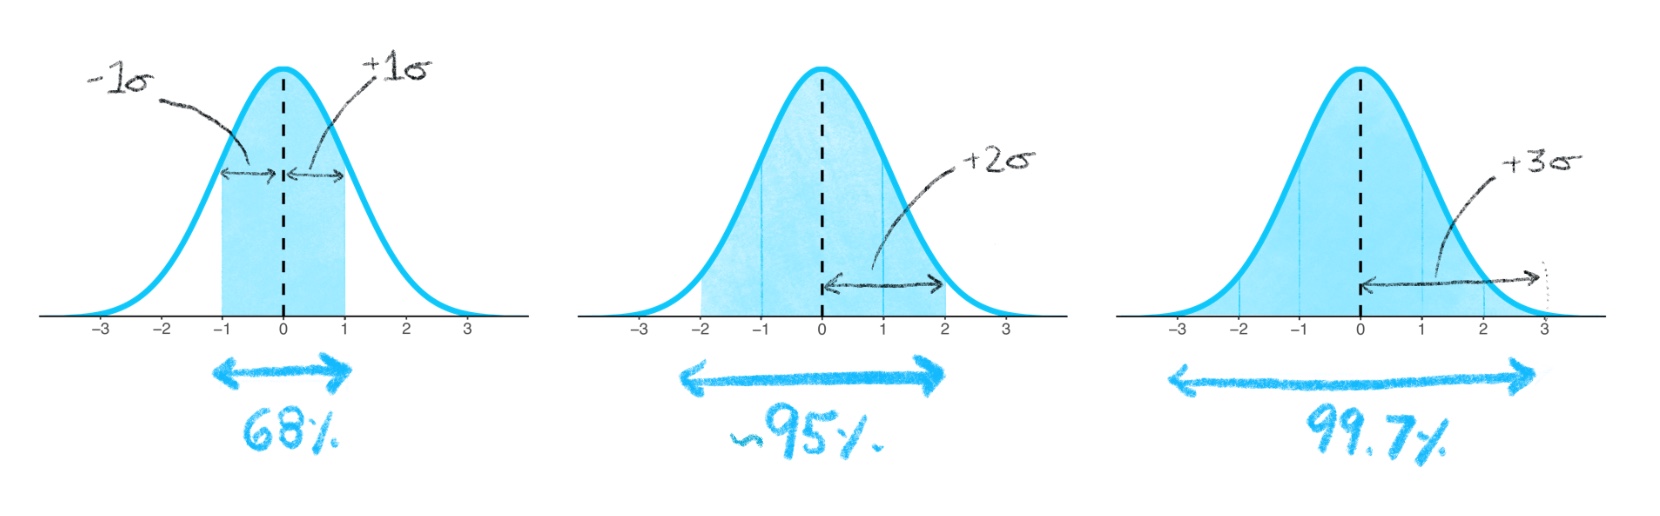
-
The entire normal distribution includes 100% of the data. The empirical rule states that the interval created by 1 standard deviation above and below the mean includes 68% of all the data. Observations within these bounds would be fairly common, but it would not be exceedingly rare to observe data that fall outside of these bounds.
-
2 standard deviations above and below the mean encompasses approximately 95% of the data. Observations that fall within these bounds include the common and also infrequent observations. Observations that fall outside of 2 standard deviations would be uncommon.
-
3 standard deviations above and below the mean encompass 99.7% of the data, capturing almost all possible observations in the set. Observations that fall oustide of these bounds into the extremes of distribution's tails would be exceedingly rare to observe (but still possible if you sample large enough groups to detect these rare events!).
Let's calculate the variance and standard deviation using 6 observations of giraffe heights from a subset of our data, including your favorite small one with the purple spots.
(1) Calculate the sample mean,
h <- c(113, 146.5, 132, 70.5, 121, 55)
mean(h)
We'll plot the mean
) (2) Find the deviation from the mean, the difference between each giraffe's height and
(2) Find the deviation from the mean, the difference between each giraffe's height and
deviation <- h - mean(h)
deviation
)
(3) Calculate Variance: Square the deviations, add them all up to get the sum of squares, and then take the average of the sum of squares (adjusted to "n-1" because we're using a sample).
SS <- sum(deviation^2)
variance <-  SS/(length(h)-1) # Divides by N-1
variance
(4) Standard Deviation: Take the square root of the variance.
sqrt(variance)
Because the standard devation is a standardized score-- we can now focus on particular giraffes and see whether or not they lie within 1 standard deviation of the mean.
)
We see the little blue spotted giraffe is more than 1 standard deviation below the mean-- and so we can conclude that a little guy of his height is rather short-- even smaller than your favorite! Similarly, the giraffe with bright pink spots is taller than 1 standard deviation above the mean-- quite tall!
Using the standard deviation and the empirical rule described earlier, we now finally have the tools to answer our original question from the start of the module: how probable it is to find a giraffe smaller than our favorite purple-spotted one?
-
Our giraffe of interest happens to be almost exactly 1 standard deviation below the mean, so this makes it easy to assess the probability of encountering a giraffe shorter than him.
-
If we assume our sample comes from a normally distributed population, then what percentage of giraffes will be shorter than the one with purple spots?
)
We can apply the knowledge that the full percentage area under the curve is 100%, and what we know from the empirical rule, to conclude that there is approximately 16% of giraffes will be shorter than the one with purple spots. So, it would be common to find giraffes taller than our favorite but somewhat of a treat to find ones smaller--like the blue one!
Maybe this explains why the little blue spotted giraffe is so cute--- it is not so common to find ones so small!
Using @ref(eq:equation4) and @ref(eq:equation5), it's easy to translate the equations for the variance and standard deviation into code in R.
-
In the window below, you will write two separate functions, one to calculate the sample variance and another to calculate the sample standard deviation. Name your functions
my_varianceandmy_sd. -
Test your functions on the vector
heights_island1and compare the output of your "handwritten" functions with the base R function ofvar( )andsd( ).
We have to correct the calculated variance by dividing by
- Let's recall that when we calculate the sum of squares, we only have the sample mean
$\bar{x}$ to go off of as our center point.
-
We must first acknowledge that while the population
$\mu$ is unknowable, the chance that the sample$\bar{x}$ and the population$\mu$ are the same is unlikely.- It's also worth pointing out that the risk that
$\bar{x}$ and$\mu$ are not even values close to each other is much increased when$\bar{x}$ has been calculated from a small sample.
- It's also worth pointing out that the risk that
-
Recognizing that the true population mean value is probably some other value than
$\bar{x}$ , let's recalculate the sum of squares. This time we will use an imaginary true population$\mu$ as our center point, which in the animation below will be represented with a line at an arbitrary distance away from$\bar{x}$ .
s <- data.frame(x=c(113, 146.5, 132, 70.5, 121, 55), y=c(9,1.5,4,4,6.5,1.5))
s <- s[order(s$x),]
s <- s[c(1,2,3,6,5,4),]
s2 <- s
s <- s[c(1,2,6,5,4,3),]
m <- mean(s[,1])
m2 <- 85
lim <- c(-73, 60)
d <- data.frame(x1=s[,1], x2=rep(m, 6), y1=s$y, y2=(abs(s[,1]-m))+s$y)
co <- c("#6FB4CE", "#D97FDA", "#DC5F24", "#C46A79", "#f93188", "#F88336")
co2 <- c("grey30", "grey40", "grey80", "grey70", "grey60", "grey50")


s2$y <- (s2$y)*-1
s2[3,2] <- -9
s2 <- s2[c(1,2,4:6,3),]
d2 <- data.frame(x1=s2[,1], x2=rep(m2, 6), y1=s2$y, y2=(-abs(s2[,1]-m2))+s2$y)

v <- do.call(cbind, lapply(1:6, function(x) seq(d[x,]$x1, d[x,]$x2, by = (d[x,]$x2-d[x,]$x1)/29)))
vv <- lapply(1:30, function(y) data.frame(x1=v[y,], x2=d$x1, y1=s$y, y2=(abs(s[,1]-m))+s$y))

v2 <- do.call(cbind, lapply(1:6, function(x) seq(d2[x,]$x1, d2[x,]$x2, by = (d2[x,]$x2-d2[x,]$x1)/29)))
vv2 <- lapply(1:30, function(y) data.frame(x1.2=v2[y,], x2.2=d2$x1, y1.2=s2$y, y2.2=(abs(s2[,1]-m2))+s2$y))

vv <- lapply(1:30, function(x) cbind(vv[[x]], vv2[[x]]))

pp <- function(x){
  p1 <- ggplot()+geom_point(data=s, aes(x=x, y=y),color=co, size=3)+geom_point(data=s2, aes(x=x, y=y),color=co2, size=3)+theme_light()+ylim(lim)+geom_segment(aes(x = x2, y = y1, xend = x1, yend = y1), data = x, color=co, size=1.5)+geom_segment(aes(x = x2.2, y = y1.2, xend = x1.2, yend = y1.2), data = x, color=co2, size=1.5)+labs(x="Teacup giraffe heights", y=NULL)+theme(panel.border=element_blank(),panel.grid.minor=element_blank(), axis.ticks=element_blank())+
    geom_segment(aes(x=m, xend=m, y=0, yend=lim[2]), linetype="dashed", color="black", size=1.5)+
    geom_segment(aes(x=m2, xend=m2, y=0, yend=lim[1]), linetype="solid", color="black", size=1.5)+
    annotate('text', x = 80, y = -60, label = "mu",parse = TRUE,size=12)+
    annotate('text', x = 111.33, y = 53, label = "bar(x)",parse = TRUE,size=12)
  p1
}

lapply(vv, function(x) pp(x))

h <- do.call(cbind, lapply(1:6, function(x) seq(d[x,]$y1, d[x,]$y2, by = (d[x,]$y2-d[x,]$y1)/29)))
hh <- lapply(1:30, function(y) data.frame(x1=s[,1], x2=rep(m, 6), y1=s$y, y2=h[y,]))

h2 <- do.call(cbind, lapply(1:6, function(x) seq(d2[x,]$y1, d2[x,]$y2, by = (d2[x,]$y2-d2[x,]$y1)/29)))
hh2 <- lapply(1:30, function(y) data.frame(x1.2=s2[,1], x2.2=rep(m2, 6), y1.2=s2$y, y2.2=h2[y,]))

hh <- lapply(1:30, function(x) cbind(hh[[x]], hh2[[x]]))

pp2 <- function(x){
  p2 <- ggplot()+geom_point(data=s, aes(x=x, y=y),color=co, size=3)+geom_point(data=s2, aes(x=x, y=y),color=co2, size=3)+theme_light()+ylim(lim)+geom_segment(aes(x = x1, y = y1, xend = x2, yend = y1), data = d, color=co, size=1.5)+geom_segment(aes(x = x1, y = y1, xend = x2, yend = y1), data = d2, color=co2, size=1.5)+
  geom_segment(aes(x = x1.2, y = y2.2, xend = x1.2, yend = y1.2), data = x, color=co2, size=1.5)+geom_segment(aes(x = x1, y = y2, xend = x1, yend = y1), data = x, color=co, size=1.5)+labs(x="Teacup giraffe heights", y=NULL)+theme(panel.border=element_blank(),panel.grid.minor=element_blank(), axis.ticks=element_blank())+
    geom_segment(aes(x=m, xend=m, y=0, yend=lim[2]), linetype="dashed", color="black", size=1.5)+
    geom_segment(aes(x=m2, xend=m2, y=0, yend=lim[1]), linetype="solid", color="black", size=1.5)+
    annotate('text', x = 80, y = -60, label = "mu",parse = TRUE,size=12)+
    annotate('text', x = 111.33, y = 53, label = "bar(x)",parse = TRUE,size=12)
p2
}

lapply(hh, function(x) pp2(x))

pp22 <- function(x){
  p2 <- ggplot()+theme_light()+geom_rect(data=d, mapping=aes(xmin=x1, xmax=x2, ymin=y1, ymax=y2), color=alpha(co, x),fill=co, alpha=x/5, size=1.5)+geom_rect(data=d2, mapping=aes(xmin=x1, xmax=x2, ymin=y1, ymax=y2), color=alpha(co2, x),fill=co2, alpha=x/5, size=1.5)+ylim(lim)+geom_segment(aes(x = x1, y = y1, xend = x2, yend = y1), data = d, color=co, size=1.5)+geom_segment(aes(x = x1, y = y1, xend = x2, yend = y1), data = d2, color=co2, size=1.5)+
  geom_segment(aes(x = x1, y = y2, xend = x1, yend = y1), data = d, color=co, size=1.5)+geom_segment(aes(x = x1, y = y2, xend = x1, yend = y1), data = d2, color=co2, size=2)+geom_point(data=s, aes(x=x, y=y),color=co, size=3)+geom_point(data=s2, aes(x=x, y=y),color=co2, size=3)+
    labs(x="Teacup giraffe heights", y=NULL)+theme(panel.border=element_blank(),panel.grid.minor=element_blank(), axis.ticks=element_blank())+
    geom_segment(aes(x=m, xend=m, y=0, yend=lim[2]), linetype="dashed", color="black", size=1.5)+
    geom_segment(aes(x=m2, xend=m2, y=0, yend=lim[1]), linetype="solid", color="black", size=1.5)+
    annotate('text', x = 80, y = -60, label = "mu",parse = TRUE,size=12)+
    annotate('text', x = 111.33, y = 53, label = "bar(x)",parse = TRUE,size=12)
p2
}
lapply(seq(0,1,0.1), function(x) pp22(x))

pp3 <- function(x){
p3 <- ggplot()+theme_light()+geom_rect(data=d, mapping=aes(xmin=x1, xmax=x2, ymin=y1, ymax=y2), color=co,fill=co, alpha=0.2, size=1.5)+geom_rect(data=d2, mapping=aes(xmin=x1, xmax=x2, ymin=y1, ymax=y2), color=co2,fill=co2, alpha=0.2, size=1.5)+geom_point(data=s, aes(x=x, y=y), color=co, size=3)+geom_point(data=s2, aes(x=x, y=y), color=co2, size=3)+ylim(lim)+labs(x="Teacup giraffe heights", y=NULL)+theme(panel.border=element_blank(),panel.grid.minor=element_blank(), axis.ticks=element_blank())+
    geom_segment(aes(x=m, xend=m, y=0, yend=lim[2]), linetype="dashed", color="black", size=1.5)+
    geom_segment(aes(x=m2, xend=m2, y=0, yend=lim[1]), linetype="solid", color="black", size=1.5)+
    annotate('text', x = 80, y = -60, label = "mu",parse = TRUE,size=12)+
    annotate('text', x = 111.33, y = 53, label = "bar(x)",parse = TRUE,size=12)
p3
}
lapply(1:15, function(x) pp3())
- When we compare the sum of squares in both of these scenarios: 1) using
$\bar{x}$ or 2) using our imaginary$\mu$ , we see that the sum of squares from$\mu$ will always be greater than the$\bar{x}$ sum of squares. This is true because by definition of being the sample mean, the line at$\bar{x}$ will always be the "center" of the values in our sample. Its location already minimizes the total distance of all the observations to the center. A line at any other location (i.e.$\mu$ ) would be a line that is not mimimizing the distance for observations in our sample.
-
Therefore, when we calculate the sum of squares (and consequently, the variance and the standard deviation) using the sample mean
$\bar{x}$ , we are most likely arriving at a value that is downwardly biased compared to what the true variance or standard deviation would be if we were able to know and use the population mean$\mu$ . -
This is why we need to adjust our sample variance by diving by
$n-1$ instead of just$N$ . By diving by a smaller value (i.e.$n-1$ instead of N), we ensure that the overall value of the variance and standard deviation will be a little larger, correcting for the downward bias we just described.
How badly might the sample variance be downwardly biased?: Well, it depends on how far away
-
Of course, we want to avoid having a very downwardly biased variance. What controls how far away
$\bar{x}$ is from$\mu$ ? The sample size! As pointed out previously, the larger the sample, the greater the likelihood that your sample mean will resemble the population mean. -
Press Play on the animation below. The plot shows the relationship between bias in the variance, the sample size, and the distance between
$\bar{x}$ and$\mu$ . Each dot represents one out of a thousand random samples all from the same population. The vertical dotted line represents$\mu$ , and the horizontal dotted line represents the true population variance (animation inspired by Khan Academy video.)
set.seed(12)
d <- rnorm(50, 10, 2)
d1 <- rnorm(50, 18, 1.2)
d <- c(d,d1)
mm <- mean(d)
v <- var(d)
gen_data <- function(x){
  d2 <- sample(size=sample(size=1, seq(from = 2, to = 10, by = 1)), d)
  dd <- data.frame(mean=mean(d2), unb_var=var(d2), b_var=var(d2)* (length(d2) - 1) / length(d2), N=length(d2), perc=(var(d2)* (length(d2) - 1) / length(d2))/var(d))
}

data <- do.call(rbind, lapply(1:1003, function(x) gen_data()))

ff <- function(x){
  d <- data[1:x,]
  d$frame <- x+1
  return(d)
}

pd <- do.call(rbind, lapply(seq(9, 1000, 10), function(x) ff(x)))

p <- data.frame(mean=Inf, unb_var=Inf, b_var=Inf, N=2, perc=Inf, frame=0)
pd <- rbind(pd, p)

vline <- function(x = 0, color = "black") {
  list(
    type = "line",
    y0 = 0,
    y1 = 1,
    yref = "paper",
    x0 = x,
    x1 = x,
    line = list(color = color, dash="dash", width=3)
  )
}

hline <- function(y = 0, color = "black") {
  list(
    type = "line",
    x0 = 0,
    x1 = 1,
    xref = "paper",
    y0 = y,
    y1 = y,
    line = list(color = color, dash="dash", width=3)
  )
}

m <- list(
  l = 100,
  r = 100,
  b = 10,
  t = 10,
  pad = 4
)

p <- pd %>%
  plot_ly(
    width=700,
    height=450,
    type = 'scatter',
    mode='markers',
    x = ~mean,
    y = ~b_var,
    frame = ~frame,
    color = ~N,
    colors = c("midnightblue", "skyblue2"),
    marker = list(size = 20, opacity=0.75),
    hoverinfo="text",
    text=~paste("Mean:", round(mean, 2), "\nVariance:",
                round(b_var, 2))
  )%>%
  animation_opts(
    frame = 1,
    transition = 0,
    redraw = FALSE
  )%>%
  config(displayModeBar = F) %>%
    layout(margin=m,autosize=F,
      xaxis = list(range=c(7,20.5), zeroline=FALSE, title="Mean"),
      yaxis = list(range=c(-2,38), zeroline=FALSE, title="Biased variance"),
      shapes = list(hline(v),vline(mm)))%>%
  animation_slider(currentvalue = list(prefix = "Number of Samples: ", font = list(color="grey70", size=14)))
  htmltools::save_html(p,here("images/04_variance/mega_dots.html"))
-
When the samples whose means
$\bar{x}$ are far off from the true population mean, they tend to have downwardly biased variance. -
Take a look at the points that are furthest away from the true population mean-- the samples represented by these points primarily came from small sample sizes (dark blue dots).
The plot below shows the percentage of the true population variance that an uncorrected sample variance achieves on average. These data were generated by sampling from the same population as the animation above. This time the data have been grouped into bars by how many observations each random sample had. (Animation inspired by Khan Academy video)
data <- do.call(rbind, lapply(1:20000, function(x) gen_data()))
mm <- aggregate(b_var~N, data=data, function(y) (mean(y)/var(d))*100)


p2 <- mm %>%
  plot_ly(
    width=650,
    height=350,
    type = 'bar',
    x = ~N,
    y = ~b_var,
    color = ~N,
    colors = c("midnightblue", "skyblue2"),
    marker = list(size = 2, opacity=1),
    hoverinfo="y"
  )%>%
  config(displayModeBar = F) %>%
  layout(margin=m,autosize=F,
    yaxis = list(range=c(0,90), zeroline=FALSE, title="Biased Sample variance / Pop. variance (%)"),
    xaxis = list(title="Sample Size"))%>%
  hide_colorbar()
  htmltools::save_html(p2, here("images/04_variance/static_bar.html"))
-
Notice that the variances from smaller samples do the worst job of approaching 100% of the true variance. In fact, without correction the sample variance is downwardly biased by a factor of
$n/(n-1)$ . -
You can hover over the bars above to see what the average percentage of the true variance actually is for the different samples sizes. If we multiply this percentage by the correction, we fix the discrepancy between sample and population variance. We demonstrate this below for samples of size n = 3.
n = 3
correction = n/(n-1)

hover_value = 67.22902 # % value when hovering over bar for n = 3

# Apply correction
percent_of_true_variance <- hover_value * correction

percent_of_true_variance
As we can see, the correction works by adjusting the downwardly biased sample variance to close to 100% of the true variance.
Try hovering over a few other bars and see yourself that correction works independent of the sample size. You can use the window below as a calculator to change the N and the hover values and then run the code.
<iframe class="interactive" id="myIframe2" src="https://tinystats.shinyapps.io/04-variance-ex2/" scrolling="no" frameborder="no"></iframe> <script> iFrameResize({}, ".interactive"); </script>title: "Covariance and Correlation" output: bookdown::html_document2: includes: in_header: assets/05_correlation_image.html after_body: assets/foot.html
library(MASS)
library(plotly)
library(here)
library(ggplot2)
:::obj
Module learning objectives
- Create a scatterplot using ggplot
- Identify the similarities and differences between calculating the variance and covariance
- Write a function for the covariance and Pearson's correlation coefficient
- Interpret the meaning behind Pearson's correlation correlation
- Describe the purpose of dividing by the product of the standard deviations when calculating the correlation.
:::
Over the course of your time on the islands, you notice that the teacup giraffes seem to have an affinity for celery, which you have already used to entice so they come close enough for a height measurement. Suprisingly, one of the small ones had eaten so much of it! You decide to quantify how much celery each of the giraffes consumed to see if there is any relationship to height.
You systematically measure the amount of celery eaten and add it to your log of data, which is stored as a data frame called giraffe_data.
We can check out the first entries of the data frame by using the head( ) command:
set.seed(12)
x1 <- rnorm(50, 10, 2)

x2 <- scale(matrix(rnorm(50), ncol=1))
x12 <- cbind(scale(x1),x2)

c1 <- var(x12)
chol1 <- solve(chol(c1))
newx <-  x12 %*% chol1

newc <- matrix(c(1,-0.52, -0.52, 1), ncol=2)
chol2 <- chol(newc)
finalx <- newx %*% chol2 * sd(x1) + mean(x1)

finalx[,2] <- (2*finalx[,2]-5)

giraffe_data <- finalx
colnames(giraffe_data) <- c("Heights", "Celery_Eaten")

giraffe_data <- as.data.frame(giraffe_data)
points <- giraffe_data[c(12, 50, 14, 43, 32),]
head(giraffe_data)
It's difficult to get an idea if there's any relationship by just looking at the data frame. We learn so much more from creating a plot. Let's revisit our newly acquired ggplot skills to make a scatter plot.
A lot of the code used previously can be re-used for the scatter plot. Two main differences are the following:
(1) Because we now have an additional variable, we need to assign a y = for the aes( ) command within ggplot( ). Create the plot so that Celery_Eaten will be on the y-axis.
(2) Add (+) a geom_point( ) element instead of geom_hist( )
Also, we will add lines to our plot, representing the mean of each variable. Here's how we'll do that:
(3) Add a horizontal line by adding (+) a geom_hline( ) component. This takes the argument yintercept = , which equals the value for where the horizontal line should cross the y-intercept.
* Since we want to place this line at the mean of y variable (mean( ) function instead of specifying a numeric value directly.
(4) Add a vertical line by following the same structure as above but using geom_vline( ) and xintercept = instead. This vertical line will represent the mean (
Construct a scatter plot of the data using the window below:
<iframe class="interactive" id="myIframe1" src="https://tinystats.shinyapps.io/05-correlation-ex1/" scrolling="no" frameborder="no"></iframe>Great, now you have a scatter plot! But recalling the email from your advisor the last time you plotted data, you decide you'd like to customize the look of the plot the same way you did when you created the ggplot histogram.
Play around with some aesthetics in the window below, and then run the solution to see what we chose.
<iframe class = "interactive" id="myIframe2" src="https://tinystats.shinyapps.io/05-correlation-ex2/ " scrolling="no" frameborder="no"></iframe>Looking at the scatter plot, there seems to be a relationship between height and celery eaten, but you will need to quantify this more formally to be sure.
How can the relationship between two variables (and its strength) be quantified? This can be done by assessing how the two variables change together -- one such measure is the covariance.
The covariance elegantly combines the deviations of observations from two different variables into a single value. This is how it's done:
(1) As we did for the variance, we begin by measuring how far each observation lies from its mean. But unlike when we calculated the variance, each observation now includes two variables. We will need to calculate the observation's distance from each variable's mean. We call each distance the deviation scores on x and on y, respectively. Like the variance, the observation can fall above or below the mean, and as a result the corresponding deviation score will have either a positive or negative sign.
We observe this below with a subset of 5 points from our scatter plot. Positive deviations are shown in red, negative deviations in blue.
{width=650px}Why do we use the deviations? Because we want to know whether the x-values and y-values move together with respect to their means or not. For example, when an observation's deviation on x is above
After obtaining the deviation scores, we need to combine them into a single measure. We do not simply combine the deviation scores themselves by adding (please see the page about the variance for a discussion of why this is). Instead, we take both deviation scores from the same observation and multiply them together to create a two-dimensional "shape" (analagous to when we multiplied a single deviation score by itself to create a square in the variance calculation).
NOTE: The resulting value is now on the order of a "squared" term. This will become important later.
(2) Multiply the two deviation scores. This is called the crossproduct. The shapes created by the crossproduct will serve as the "squared" terms that we can then use in the next step to sum and summarize the deviations into a single value.
The equation is shown below for the sample crossproduct of the deviation scores.
Let's explore the attributes of the crossproduct:
-
First, we should note that the overall sign of the crossproduct will depend on whether or not the two x- and y- values from the same observation move in the same directions relative to their means. Look at the annotated plot below. The crossproducts will either create "negative" shapes (shown in blue) or "positive" shapes (in red). A third outcome is that the crossproduct could also be 0 -- this will occur when an observation falls on the mean.
-
Second, the magnitude of the crossproduct will scale with the absolute value of the deviation scores. In other words, the further away both deviation scores are from their means, the larger the area of their shapes will be.
The animation below shows the "construction" of the crossproducts from the 5 observations we have been following:
set.seed(12)
x1 <- rnorm(50, 10, 2)

x2 <- scale(matrix(rnorm(50), ncol=1))
x12 <- cbind(scale(x1),x2)

c1 <- var(x12)
chol1 <- solve(chol(c1))
newx <-  x12 %*% chol1

newc <- matrix(c(1,-0.52, -0.52, 1), ncol=2)
chol2 <- chol(newc)
finalx <- newx %*% chol2 * sd(x1) + mean(x1)

finalx[,2] <- (2*finalx[,2]-5)

giraffe_data <- finalx
colnames(giraffe_data) <- c("Heights", "Celery_Eaten")

giraffe_data <- as.data.frame(giraffe_data)

points <- giraffe_data[c(12, 50, 14, 43, 32),]
m = mean(giraffe_data[,1])
m2 = mean(giraffe_data[,2])
co <- c("#289BF8", "#FF5E78", "#FF5E78", "#FF5E78", "#289BF8")
limx <- c(5.5, 14.4)
limy <- c(5.3, 23)

d <- data.frame(x1=points[,1], x2=m, y1=points[,2], y2=m2)
v <- do.call(cbind, lapply(1:5, function(x) seq(d[x,]$x1, d[x,]$x2, by = (d[x,]$x2-d[x,]$x1)/29)))
vv <- lapply(1:30, function(y) data.frame(x1=v[y,], x2=d$x1, y1=points[,2], y2=points[,2]))

pp <- function(x){
  p1 <- ggplot()+geom_point(data=points, aes(x=Heights, y=Celery_Eaten),color=co, size=4)+
    theme_light()+geom_segment(aes(x = x2, y = y1, xend = x1, yend = y1), data = x, color=co, size=2)+labs(x="Heights", y="Celery Eaten")+theme(panel.border=element_blank(),panel.grid.minor=element_blank(), axis.ticks=element_blank())+xlim(limx)+ylim(limy)+geom_vline(xintercept = mean(giraffe_data$Heights), col="grey50", linetype="dashed", size = 2) + geom_hline(yintercept = mean(giraffe_data$Celery_Eaten), col= "grey81", linetype="dashed", size= 2)
  p1
}

lapply(vv, function(x) pp(x))

h <- do.call(cbind, lapply(1:5, function(x) seq(d[x,]$y1, d[x,]$y2, by = (d[x,]$y2-d[x,]$y1)/29)))
hh <- lapply(1:30, function(y) data.frame(x1=points[,1], x2=m, y1=points[,2], y2=h[y,]))

pp2 <- function(x){
  p2 <- ggplot()+geom_point(data=points, aes(x=Heights, y=Celery_Eaten),color=co, size=4)+
    theme_light()+geom_segment(aes(x = x1, y = y1, xend = x2, yend = y1), data = d, color=co, size=2)+
  geom_segment(aes(x = x1, y = y2, xend = x1, yend = y1), data = x, color=co, size=2)+labs(x="Heights", y="Celery Eaten")+theme(panel.border=element_blank(),panel.grid.minor=element_blank(), axis.ticks=element_blank())+xlim(limx)+ylim(limy)+geom_vline(xintercept = mean(giraffe_data$Heights), col="grey50", linetype="dashed", size = 2) + geom_hline(yintercept = mean(giraffe_data$Celery_Eaten), col= "grey81", linetype="dashed", size= 2)
  p2
}

lapply(hh, function(x) pp2(x))

pp22 <- function(x){
  p2 <- ggplot()+theme_light()+geom_rect(data=d, mapping=aes(xmin=x1, xmax=x2, ymin=y1, ymax=y2), color=alpha(co, x),fill=co, alpha=x/5, size=2)+geom_segment(aes(x = x1, y = y1, xend = x2, yend = y1), data = d, color=co, size=2)+
  geom_segment(aes(x = x1, y = y2, xend = x1, yend = y1), data = d, color=co, size=2)+
    geom_point(data=points, aes(x=Heights, y=Celery_Eaten),color=co, size=4)+
    labs(x="Heights", y="Celery Eaten")+theme(panel.border=element_blank(),panel.grid.minor=element_blank(), axis.ticks=element_blank())+xlim(limx)+ylim(limy)+geom_vline(xintercept = mean(giraffe_data$Heights), col="grey50", linetype="dashed", size = 2) + geom_hline(yintercept = mean(giraffe_data$Celery_Eaten), col= "grey81", linetype="dashed", size= 2)
p2
}
lapply(seq(0,1,0.1), function(x) pp22(x))

pp3 <- function(x){
p3 <- ggplot()+theme_light()+geom_rect(data=d, mapping=aes(xmin=x1, xmax=x2, ymin=y1, ymax=y2), color=co,fill=co, alpha=0.2, size=2)+
  geom_point(data=points, aes(x=Heights, y=Celery_Eaten),color=co, size=4)+
  labs(x="Heights", y="Celery Eaten")+theme(panel.border=element_blank(),panel.grid.minor=element_blank(), axis.ticks=element_blank())+xlim(limx)+ylim(limy)+geom_vline(xintercept = mean(giraffe_data$Heights), col="grey50", linetype="dashed", size = 2) + geom_hline(yintercept = mean(giraffe_data$Celery_Eaten), col= "grey81", linetype="dashed", size= 2)
p3
}
lapply(1:15, function(x) pp3())
\
(3) Sum the crossproducts. The sum of the crossproduct gives us a single number.
As we add the crossproducts, some of the "negative" and "positive" values of the shapes will cancel each other out. This is okay because this tells us important information about our two variables. If the negative and positive shapes cancel each other out completely, it would mean that there is no relationship. In most cases this will not happen, and the sum of the crossproducts will be positive or negative. In general, the larger the magnitude of the sum of the crossproducts, the more strongly the two variables move together. The equation is shown below.
(4) We then divide the sum of the crossproduct by
The equation for the covariance (abbreviated "cov") of the variables x and y is shown below. As a preference of style, we multiply by
However, the covariance is not an intuitive value. Remember that we have been working with terms that are on the "squared" scale, which is not only difficult to interpret (just like the variance is) but it is also the product of two variables on possibly different scales. How could we interpret a covariance with units of millimeters*grams mean?
Another point to make is that value of the covariance will be vastly different if we had decided to change the units (millimeters vs centimeters, or grams vs kilograms).
As a result, the covariance is not an easy metric to work with or to compare with other covariances. So we need to standardize it!
How do we standardize the covariance?
The solution is to (1) take the standard deviations of each variable, (2) multiply them together, and (3) divide the covariance by this product -- the resulting value is called the Pearson correlation coefficient. When referring to the population correlation coefficient, the symbol
Here is the equation for the population correlation:
We can interpret the correlation as a measure of the strength and direction of the relationship between two variables. It is a "standardized" version of the covariance.
- The correlation will always be between -1 and 1. At these extreme values, the two variables have the strongest relationship possible, in which each data point will fall exactly on a line. When the absolute value of the correlation coefficient approaches 0, the observations will be more "scattered".
- The sign of the correlation coefficient indicates the direction of the linear relationship. When
$r$ = 0 there is no relationship between the variables. Look at the figure below to see what observations of different$r$ values look like.
Your turn
Imagine you're given a plot like the one below. What would you say it's correlation value is? Try out your guess for a few plots, and if you need a hint to help you visualize, click Show trend line.
<iframe class="interactive" src="https://tinystats.shinyapps.io/Guess_corr/?showcase=0" scrolling="no" frameborder="no"></iframe>- In the window below, write your own function to compute the sample covariance of two variables, and call it
my_covariance( ). - Then create a second function called
my_correlation( )in which you will compute the correlation of two variables. You may incorporate your functionmy_covariance( )in this step to save yourself some time. - Once you've created both functions, use them to compute the covariance and correlation between
HeightsandCelery_Eatenwithin the data framegiraffe_data. - Finally, compare your functions' outputs with the base R functions for covariance,
cov( )andcor( ).
Remember, you will need to write both functions so that they will take two parameters, one for each variable. The parameters for my_covariance( ) have been setup for you.
\
Wow, you can see that there is a negative relationship between giraffe heights and how much celery teacup giraffes eat. Could this be due to celery being a negative calorie vegetable? Are these giraffes onto something?
{width=30%}You can take a look at the animation below to see a conceptual summary of how correlation will standarize the covariance, translating it into an easily interpretable metric that will always be bound by -1 and 1.
Well it's complicated, (see here and here) but it builds on the mathematical principle that the covariance of x and y will never exceed the product of the standard deviations of x and y. This means that the maximum correlation value will occur when the absolute value of the covariance and the product of the standard deviations are equal.
If you don't take our word for it, press play below to see what the relationship between
cor_var <- function(x){
  r <- 0
  d <- mvrnorm(n = 6, mu = c(0,0), Sigma = matrix(c(1, r, r, 2), nrow = 2))
  d <- round(d, 1)
  return(d)
}

d <- lapply(1:5006, function(x) cor_var())
dd <- as.data.frame(do.call(rbind, lapply(d, function(x) cbind(var(x)[1,1], var(x)[2,2], var(x)[1,2], cor(x)[1,2]))))
colnames(dd) <- c("var_x", "var_y", "cov_xy", "cor")
dd$p_sd <- sqrt(dd$var_x)*sqrt(dd$var_y)

ff <- function(x){
  d <- dd[1:x,]
  d$frame <- x+1
  return(d)
}

pd <- do.call(rbind, lapply(seq(99, 3000, 100), function(x) ff(x)))

p <- data.frame(var_x=Inf, var_y=Inf, cov_xy=Inf, cor=0, p_sd=Inf, frame=0)
pd <- rbind(pd, p)
pd <- round(pd, 2)

m <- list(
  l = 100,
  r = 100,
  b = 10,
  t = 10,
  pad = 4
)

p <- pd %>%
  plot_ly(
    width=700,
    height=450,
    type = 'scatter',
    mode='markers',
    x = ~cov_xy,
    y = ~p_sd,
    frame = ~frame,
    color = ~cor,
    colors = c("#289BF8","#FF5E78"),
    marker = list(size = 12, opacity=1),
    hoverinfo="text",
    text=~paste("Covariance:", round(cov_xy, 2), "\nPooled SD:",
                round(p_sd, 2))
  )%>%
  animation_opts(
    frame = 100,
    transition = 0,
    redraw = FALSE
  )%>%
  config(displayModeBar = F) %>%
  layout(margin= m, autosize=F,
    xaxis = list(range=c(-3,3), zeroline=FALSE, title="Covariance"),
    yaxis = list(range=c(-0.1,4.5), zeroline=FALSE, title="Product of standard deviations")
    )%>%
  animation_slider(currentvalue = list(prefix = "Number of Samples: ", font = list(color="grey70", size=14)))

htmltools::save_html(p,here("images/05_correlation/cov_vs_sxsy.html"))
As you look at the plot above, you may have the following questions:
-
Why are there clearly defined boundaries?
-
Because at the edges is where the covariance is the greatest value that it can be-- it is equal to the product of the standard deviations there.
-
The slope is 1 at this boundary.
-
-
Where in the plot do the strongest correlations end up?
- On the edges -- when the absolute value of the numerator and denominator of the equation are equal-- the quotient will = 1 (or negative 1, depending on the sign of the covariance in the numerator).
Correlation does not capture relationships that are not linear: If the relationship is not linear, then correlation will not be meaningful. Check out the plot below. There is a clear U-shaped relationship between the two variables, but the correlation coefficient for these data is very close to 0. To measure non-linear relationships a different metric must be used.
{width=40%}Correlation is not causation: Just because there is a linear relationship between two variables does not mean we have evidence that one variable causes the other. Even if there really was a cause-and-effect relationship, with correlation we cannot say which variable is the cause and which is the effect. It's also possible that there exists some other unmeasured variable affecting the linear relationship we observe. And of course, any apparent relationship may be due to nothing more than random chance.
<script> iFrameResize({}, ".interactive"); </script>title: "Intro to Inference" output: bookdown::html_document2: includes: in_header: assets/06_standardError_image.html after_body: assets/foot.html
library(ggplot2)
library(tweenr)
library(parallel)
library(MASS)
:::obj Module learning objectives
- Determine how to quantify the uncertainty of an estimate
- Describe the concept of statistical inference
- Interpret sampling distributions and explain how they are influenced by sample size
- Define and calculate standard error
- Use the standard error to construct 95% confidence intervals :::
Let's revisit the first few days during which we collected data stored in the vector heights_island1. We were able to verify that the heights were normally distributed and calculated our sample mean,
Not all sample means are created equal. Some are better estimates than others. Recall the animation showing the relationship between sample size and variability of the mean. As we learned from this animation, in the long-run, large samples are necessary to get an accurate estimate of
One reason we care about our sample estimate's accuracy is because we want to be able to answer questions about the population by making inferences. Statistical inference uses math to draw conclusions about the population based on a subset of the full picture (i.e. a sample). Subsets of data are of course limited, so it's therefore important to acknowledge that the strength of the conclusions drawn about the population is dependent on the precision of the sample estimate. For example, say that we guess that the population mean value of giraffe heights on Island 1 is less than 11 cm. We can make some inferences about whether or not this is a good guess based on what we learn from our sample of giraffe heights. We'll revisit this question a few times below.
The mean of our sample of 50 giraffes from Island 1 was:
set.seed(12)
heights_island1 <- rnorm(50, 10, 2)
mean(heights_island1)
How can we quantify the accuracy of this estimate, given its sample size?
In theory, one way to illustrate this is to generate data not just from a single sample but from many samples of the same size (N) drawn from the same population.
Imagine that after you collected all 50 measurements for heights_island1, you wake up one morning with no memory of collecting data at all---and so you go out and collect 50 giraffe heights again and subsequently calculate the mean. Further imagine that this groundhog day (or more correctly, groundhog week) situation repeats itself many, many times.
When you finally return to your sanity, you find stacks of notebooks filled with mean values from each of your individual data collections.
{width=600px}Instead of viewing this as a massive waste of time, you make the best out of the situation and create a histogram of all the means. In other words you create a plot showing the distribution of the sample means, also known as a sampling distribution.
The animation below illustrates the process of creating the sampling distribution for 1,000 sample means.
On the left side, each histogram represents a sample (e.g. heights_island1 would be one sample, and we're flashing through 1,000 of them in total). Correspondingly, each dot signifies an observation. After each sample histogram is completed,
ppplot <- function(sub){ x <- round(rnorm(50, 9.7, 2.1)) m <- mean(x) df <- data.frame(x = x, y = 23) dfs <- list(df) for(i in seq_len(nrow(df))) { dftemp <- tail(dfs, 1) dftemp[[1]]$y[i] <- sum(dftemp[[1]]$x[seq_len(i)] == dftemp[[1]]$x[i]) dfs <- append(dfs, dftemp) } dfs <- append(dfs, dfs[rep(length(dfs), 3)]) dft <- tween_states(dfs, 10, 1, 'cubic-in', 50) dft$y <- dft$y - 0.5 dft <- dft[dft$y != 23, ]
ppl <- function(frame){ p <- ggplot(data = dft[dft$.frame==frame,], aes(x=x, y=y)) + geom_point(shape=16, color="green3", size = 4) + ylim(0,16) + xlim(3,17) + theme_light() + theme(panel.border = element_blank(), panel.grid.minor=element_blank()) + labs(x="Giraffe Heights", y=NULL) df <- data.frame() p2 <- ggplot(df) + geom_point() + xlim(0, 16) + ylim(3, 17)+theme_void() p3 <- ggplot(df) + geom_point() + xlim(8.7, 10.7) + ylim(0, 150) + theme_light() + theme(panel.border=element_blank(), panel.grid.minor=element_blank()) + labs(x = "Sample means", y = NULL) cowplot::plot_grid(p, p2, p3, align ="h", rel_widths = c(1, 0.55, 1), ncol = 3)
}
ppl2 <- function(frame){ p <- ggplot(data=dft[dft$.frame==53,], aes(x=x, y=y)) + geom_point(shape = 16, color = "green3", size = 4) + ylim(0,16) + xlim(3,17) + theme_light() + theme(panel.border = element_blank(), panel.grid.minor = element_blank()) + geom_vline(xintercept = m, linetype = 2) + labs(x = "Giraffe Heights", y = NULL) p df <- data.frame() lb1 <- paste0("bar(x)", "[", sub, "]", " == ", round(m,2)) p2 <- ggplot(df) + geom_point() + xlim(0, 16) + ylim(3, 17) + theme_void() + annotate("text", x = 8, y=10, label = lb1, parse = TRUE, size = 7) + annotate("segment", x = 1, xend = 15, y = 8, yend = 8, colour = "black", size = 1, arrow = arrow(type = "closed", length = unit(0.3,"cm"))) p3 <- ggplot(df) + geom_point() + xlim(8.7, 10.7) + ylim(0, 150)+theme_light()+theme(panel.border=element_blank(), panel.grid.minor=element_blank())+annotate("segment", x = m, xend = m, y = 20, yend = 4, colour = "black", size=1, arrow=arrow(type = "closed", length = unit(0.3,"cm")))+labs(x="Sample means", y=NULL) cowplot::plot_grid(p,p2,p3, align="h", rel_widths = c(1,0.55,1), ncol = 3) }
pf <- list(lapply(seq(1, 53, 2), function(x) ppl(x)), lapply(rep(53, 3), function(x) ppl(x)), lapply(1:40, function(x) ppl2())) return(pf) } mclapply(1:3, function(x) ppplot(x), mc.cores = 8, mc.cleanup = TRUE)
circleFun <- function(center=c(0,0), diameter=1, npoints=100, start=0, end=2, filled=TRUE){ tt <- seq(startpi, endpi, length.out=npoints) df <- data.frame( x = center[1] + diameter / 2 * cos(tt), y = center[2] + diameter / 2 * sin(tt) ) if(filled==TRUE) { df <- rbind(df, center) } return(df) } fullCircle <- circleFun(c(1, -1), 2.3, start=0, end=2, filled=FALSE) fullCircle2 <- circleFun(c(1, -1), 2, start=0, end=2, filled=FALSE) fullCircle3 <- circleFun(c(1, -1), 1.3, start=0, end=2, filled=FALSE) fullCircle4 <- circleFun(c(1, -1), 0.3, start=0, end=2, filled=FALSE) fullCircle5 <- circleFun(c(1, -1), 0.1, start=0, end=2, filled=FALSE)
tris <- circleFun(c(1, -1), 1.6, start=1.2, end=-0.2, filled=FALSE, npoints=50) tris2 <- circleFun(c(1, -1), 0.2, start=1.4, end=0, filled=FALSE, npoints=50) tris3 <- circleFun(c(1, -1), 0.2, start=1, end=-0.4, filled=FALSE,npoints=50)
s <- c(rep(1,10), 1:50)
trii <- lapply(s, function(x) data.frame(x=c(tris[x,1],tris2[x,1],tris3[x,1]), y=c(tris[x,2],tris2[x,2],tris3[x,2])))
quarterCircle <- circleFun(c(1,-1), diameter = 1.85, start=1, end=1.25, filled=TRUE) quarterCircle2 <- circleFun(c(1,-1), diameter = 1.85, start=0.75, end=1, filled=TRUE) quarterCircle3 <- circleFun(c(1,-1), diameter = 1.85, start=0.5, end=0.75, filled=TRUE) quarterCircle4 <- circleFun(c(1,-1), diameter = 1.85, start=0.25, end=0.5, filled=TRUE) quarterCircle5 <- circleFun(c(1,-1), diameter = 1.85, start=0.25, end=0, filled=TRUE) quarterCircle6 <- circleFun(c(1,-1), diameter = 1.85, start=2, end=1.75, filled=TRUE)
x <- round(rnorm(50, 9.7, 2.1)) m <- mean(x) df <- data.frame(x = x, y = 23) dfs <- list(df) for(i in seq_len(nrow(df))) { dftemp <- tail(dfs, 1) dftemp[[1]]$y[i] <- sum(dftemp[[1]]$x[seq_len(i)] == dftemp[[1]]$x[i]) dfs <- append(dfs, dftemp) } dfs <- append(dfs, dfs[rep(length(dfs), 3)]) dft <- tween_states(dfs, 10, 1, 'cubic-in', 50) dft$y <- dft$y - 0.5 dft <- dft[dft$y != 23, ] dft <- dft[dft$.frame %in% c(1:26, seq(27, 53, 2)),] dft$.frame <- rep(1:40, each=50)
plots <- function(dd){ p <- ggplot() + geom_polygon(data=fullCircle, aes(x, y), color="#40596b", fill="#40596b") + geom_polygon(data=fullCircle2, aes(x, y), color="white", fill="white") + geom_polygon(data=quarterCircle, aes(x,y), color="#cdd6e0", fill="#cdd6e0") + geom_polygon(data=quarterCircle2, aes(x,y), color="#acb3ba", fill="#acb3ba") + geom_polygon(data=quarterCircle3, aes(x,y), color="#ffd15c", fill="#ffd15c") + geom_polygon(data=quarterCircle4, aes(x,y), color="#f8b64c", fill="#f8b64c") + geom_polygon(data=quarterCircle5, aes(x,y), color="#ff7058", fill="#ff7058") + geom_polygon(data=quarterCircle6, aes(x,y), color="#f1543f", fill="#f1543f") + geom_polygon(data=fullCircle3, aes(x,y), color="white", fill="white") + geom_polygon(data=fullCircle4, aes(x,y), color="#40596b", fill="#40596b") + geom_polygon(data=trii[[dd]], aes(x,y), color="#40596b", fill="#40596b") + geom_polygon(data=fullCircle5, aes(x,y), color="white", fill="white") + coord_equal() + theme_void() ddd <- ifelse(dd<20, 1, ifelse(dd<35, 2, ifelse(dd<45, 3, ifelse(dd<50, 4, ifelse(dd<53, 5, ifelse(dd<55, 6, ifelse(dd<57, 7, ifelse(dd<59, 8, base::sample(1:10,1))))))))) p2 <- ggplot(data=dft[dft$.frame==dd,],aes(x=x, y=y))+geom_point(shape=16, color="green3", size=4)+ylim(0,16)+xlim(3,17)+theme_light()+theme(panel.border=element_blank(), panel.grid.minor=element_blank())+labs(x="Giraffe Heights", y=NULL) df <- data.frame() p3 <- ggplot(df) + geom_point() + xlim(8.7, 10.7) + ylim(0, 150)+theme_light()+theme(panel.border=element_blank(), panel.grid.minor=element_blank())+labs(x="Sample means", y=NULL) cowplot::plot_grid(p2,p,p3, align="h",rel_widths = c(1,0.55, 1), ncol=3) }
lapply(seq(1,40,3), function(x) plots(x))
hists <- function(x){ x <- round(rnorm(50, 9.7, 2.1)) m <- mean(x) return(m) }
dh <- do.call(rbind, lapply(1:1000, function(x) hists()))
hh <- function(x){ d <- data.frame(Height=dh[1:x]) return(d) }
dhh <<- lapply(1:1000, function(x) hh(x))
plots2 <- function(dd){ p <- ggplot() + geom_polygon(data=fullCircle, aes(x, y), color="#40596b", fill="#40596b") + geom_polygon(data=fullCircle2, aes(x, y), color="white", fill="white") + geom_polygon(data=quarterCircle, aes(x,y), color="#cdd6e0", fill="#cdd6e0") + geom_polygon(data=quarterCircle2, aes(x,y), color="#acb3ba", fill="#acb3ba") + geom_polygon(data=quarterCircle3, aes(x,y), color="#ffd15c", fill="#ffd15c") + geom_polygon(data=quarterCircle4, aes(x,y), color="#f8b64c", fill="#f8b64c") + geom_polygon(data=quarterCircle5, aes(x,y), color="#ff7058", fill="#ff7058") + geom_polygon(data=quarterCircle6, aes(x,y), color="#f1543f", fill="#f1543f") + geom_polygon(data=fullCircle3, aes(x,y), color="white", fill="white") + geom_polygon(data=fullCircle4, aes(x,y), color="#40596b", fill="#40596b") + geom_polygon(data=trii[[dd]], aes(x,y), color="#40596b", fill="#40596b") + geom_polygon(data=fullCircle5, aes(x,y), color="white", fill="white") + coord_equal() + theme_void() ddd <- ifelse(dd<20, 1, ifelse(dd<35, 2, ifelse(dd<45, 3, ifelse(dd<50, 4, ifelse(dd<53, 5, ifelse(dd<55, 6, ifelse(dd<57, 7, ifelse(dd<59, 8, base::sample(1:10,1))))))))) set.seed(ddd) x <- round(rnorm(50, 9.7, 2.1)) m <- mean(x) df <- data.frame(x = x, y = 23) dfs <- list(df) for(i in seq_len(nrow(df))) { dftemp <- tail(dfs, 1) dftemp[[1]]$y[i] <- sum(dftemp[[1]]$x[seq_len(i)] == dftemp[[1]]$x[i]) dfs <- append(dfs, dftemp) } dfs <- append(dfs, dfs[rep(length(dfs), 3)]) dft <- tween_states(dfs, 10, 1, 'cubic-in', 50) dft$y <- dft$y - 0.5 dft <- dft[dft$y != 23, ] p2 <- ggplot(data=dft[dft$.frame==53,],aes(x=x, y=y))+geom_point(shape=16, color="green3", size=4)+ylim(0,16)+xlim(3,17)+theme_light()+theme(panel.border=element_blank(), panel.grid.minor=element_blank())+geom_vline(xintercept = m, linetype=2)+labs(x="Giraffe Heights", y=NULL) df <- data.frame()
p3 <- ggplot(data = dhh[[dd-40]], aes(x = Height)) + geom_histogram(binwidth = 0.1, color = "white", fill="green3") + theme_light() + scale_y_continuous(limits = c(0,150)) + labs(x=NULL, y=NULL) + xlim(8.7, 10.7) + theme(panel.border=element_blank(), panel.grid.minor=element_blank()) + labs(x="Sample means", y=NULL) cowplot::plot_grid(p2,p,p3, align="h",rel_widths = c(1,0.55, 1), ncol=3) } lapply(seq(41,50,2), function(x) plots2(x)) lapply(seq(51,60,1), function(x) plots2(x))
plots3 <- function(dd){
p <- ggplot() + geom_polygon(data=fullCircle, aes(x, y), color="#40596b", fill="#40596b") + geom_polygon(data=fullCircle2, aes(x, y), color="white", fill="white") + geom_polygon(data=quarterCircle, aes(x,y), color="#cdd6e0", fill="#cdd6e0") + geom_polygon(data=quarterCircle2, aes(x,y), color="#acb3ba", fill="#acb3ba") + geom_polygon(data=quarterCircle3, aes(x,y), color="#ffd15c", fill="#ffd15c") + geom_polygon(data=quarterCircle4, aes(x,y), color="#f8b64c", fill="#f8b64c") + geom_polygon(data=quarterCircle5, aes(x,y), color="#ff7058", fill="#ff7058") + geom_polygon(data=quarterCircle6, aes(x,y), color="#f1543f", fill="#f1543f") + geom_polygon(data=fullCircle3, aes(x,y), color="white", fill="white") + geom_polygon(data=fullCircle4, aes(x,y), color="#40596b", fill="#40596b") + geom_polygon(data=trii[[60]], aes(x,y), color="#40596b", fill="#40596b") + geom_polygon(data=fullCircle5, aes(x,y), color="white", fill="white") + coord_equal() + theme_void()
x <- round(rnorm(50, 9.7, 2.1)) m <- mean(x) df <- data.frame(x = x, y = 23) dfs <- list(df) for(i in seq_len(nrow(df))) { dftemp <- tail(dfs, 1) dftemp[[1]]$y[i] <- sum(dftemp[[1]]$x[seq_len(i)] == dftemp[[1]]$x[i]) dfs <- append(dfs, dftemp) } dfs <- append(dfs, dfs[rep(length(dfs), 3)]) dft <- tween_states(dfs, 10, 1, 'cubic-in', 50) dft$y <- dft$y - 0.5 dft <- dft[dft$y != 23, ]
p2 <- ggplot(data=dft[dft$.frame==53,],aes(x=x, y=y))+geom_point(shape=16, color="green3", size=4)+ylim(0,16)+xlim(3,17)+theme_light()+theme(panel.border=element_blank(), panel.grid.minor=element_blank())+geom_vline(xintercept = m, linetype=2)+labs(x="Giraffe Heights", y=NULL)
hh <- function(x){ d <- data.frame(Height=dh[1:x]) return(d) }
dhh <- lapply(1:1000, function(x) hh(x)) p3 <- ggplot(data = dhh[[dd+40]], aes(x = Height)) + geom_histogram(binwidth = 0.1, color = "white", fill="green3") + theme_light() + scale_y_continuous(limits = c(0,150)) + labs(x=NULL, y=NULL) + xlim(8.7, 10.7) + theme(panel.border=element_blank(), panel.grid.minor=element_blank()) + labs(x="Sample means", y=NULL)
cowplot::plot_grid(p2,p,p3, align="h",rel_widths = c(1,0.55, 1), ncol = 3) } mclapply(seq(1,300, 20), function(x) plots3(x), mc.cores = 8, mc.cleanup = TRUE)
plots3.2 <- function(dd){ sub <- dd+40
x <- round(rnorm(50, 9.7, 2.1)) m <- mean(x) df <- data.frame(x = x, y = 23) dfs <- list(df) for(i in seq_len(nrow(df))) { dftemp <- tail(dfs, 1) dftemp[[1]]$y[i] <- sum(dftemp[[1]]$x[seq_len(i)] == dftemp[[1]]$x[i]) dfs <- append(dfs, dftemp) } dfs <- append(dfs, dfs[rep(length(dfs), 3)]) dft <- tween_states(dfs, 10, 1, 'cubic-in', 50) dft$y <- dft$y - 0.5 dft <- dft[dft$y != 23, ]
df <- data.frame() lb1 <- paste0("bar(x)", "[", sub, "]", " == ", round(m,1)) p <- ggplot(df) + geom_point() + xlim(0, 16) + ylim(3, 17)+theme_void()+annotate("text", x = 1, y=10, label=lb1, parse = TRUE, size=7,hjust = 0)+annotate("segment", x = 1, xend = 15, y = 8, yend = 8, colour = "black", size=1, arrow=arrow(type = "closed", length = unit(0.3,"cm")))
p2 <- ggplot(data=dft[dft$.frame==53,],aes(x=x, y=y))+geom_point(shape=16, color="green3", size=4)+ylim(0,16)+xlim(3,17)+theme_light()+theme(panel.border=element_blank(), panel.grid.minor=element_blank())+geom_vline(xintercept = m, linetype=2)+labs(x="Giraffe Heights", y=NULL)
hh <- function(x){ d <- data.frame(Height=dh[1:x]) return(d) }
dhh <- lapply(1:1000, function(x) hh(x)) p3 <- ggplot(data = dhh[[dd+40]], aes(x = Height)) + geom_histogram(binwidth = 0.1, color = "white", fill="green3") + theme_light() + scale_y_continuous(limits = c(0,150)) + labs(x=NULL, y=NULL) + xlim(8.7, 10.7) + theme(panel.border=element_blank(), panel.grid.minor=element_blank()) + labs(x="Sample means", y=NULL)
cowplot::plot_grid(p2,p,p3, align="h",rel_widths = c(1,0.55, 1), ncol = 3) } mclapply(seq(301,960, 20), function(x) plots3.2(x), mc.cores = 8, mc.cleanup = TRUE)
x <- round(mvrnorm(50, 9.8, 2.1^2, empirical = T)) m <- mean(x) df <- data.frame(x = x, y = 23) dfs <- list(df) for(i in seq_len(nrow(df))) { dftemp <- tail(dfs, 1) dftemp[[1]]$y[i] <- sum(dftemp[[1]]$x[seq_len(i)] == dftemp[[1]]$x[i]) dfs <- append(dfs, dftemp) } dfs <- append(dfs, dfs[rep(length(dfs), 3)]) dft <- tween_states(dfs, 10, 1, 'cubic-in', 50) dft$y <- dft$y - 0.5 dft <- dft[dft$y != 23, ]
plots4 <- function(dd){
df <- data.frame() lb1 <- paste0("bar(x)", "[", 1000, "]", " == ", 9.8) p <- ggplot(df) + geom_point() + xlim(0, 16) + ylim(3, 17)+theme_void()+annotate("text", x = 1, y=10, label=lb1, parse = TRUE, size=7,hjust = 0)+annotate("segment", x = 1, xend = 15, y = 8, yend = 8, colour = "black", size=1, arrow=arrow(type = "closed", length = unit(0.3,"cm")))
p2 <- ggplot(data=dft[dft$.frame==53,],aes(x=x, y=y))+geom_point(shape=16, color="green3", size=4)+ylim(0,16)+xlim(3,17)+theme_light()+theme(panel.border=element_blank(), panel.grid.minor=element_blank())+geom_vline(xintercept = 9.8, linetype=2)+labs(x="Giraffe Heights", y=NULL)
hh <- function(x){ d <- data.frame(Height=dh[1:x]) return(d) }
dhh <<- lapply(1:1000, function(x) hh(x)) p3 <- ggplot(data = dhh[[dd+40]], aes(x = Height)) + geom_histogram(binwidth = 0.1, color = "white", fill="green3") + theme_light() + scale_y_continuous(limits = c(0,150)) + labs(x=NULL, y=NULL) + xlim(8.7, 10.7) + theme(panel.border=element_blank(), panel.grid.minor=element_blank()) + labs(x="Sample means", y=NULL)
cowplot::plot_grid(p2,p,p3, align="h",rel_widths = c(1,0.55, 1), ncol = 3) }
mclapply(rep(960, 40), function(x) plots4(x), mc.cores = 8, mc.cleanup = TRUE)
</center>

<br>
<br>

A histogram of the sampling distribution is shown below. It is a histogram made up of many means.

<br>

<center>
```{r, tut=FALSE, echo=FALSE, message= FALSE, warning=FALSE, fig.height=2.7, fig.width=4.5, cache= TRUE}

samp <- function(n){
  x <- rnorm(n, 9.7, 2.1)
  m <- mean(x)
  s <- sd(x)
  return(c(m,s))
}

d2 <- as.data.frame(do.call(rbind, lapply(1:1000, function(x) samp(50))))
colnames(d2) <- c("mean", "sd")

ggplot(data = dhh[[1000]], aes(x = Height)) +
  geom_histogram(binwidth = 0.1, color = "white", fill = "green3") +
  theme_light() +
  scale_y_continuous(expand = c(0,0)) +
  labs(x = "Sample means", y = NULL) +
  theme(panel.border = element_blank(), panel.grid.minor = element_blank())
Looking at the spread of
The sampling distribution provides us with the first hint of the precision of our original heights_island1 estimate, which we'll quantify in more detail later on, but for now it's enough to notice that the range of possible r round(min(d2$mean),1) and r round(max(d2$mean), 1). This means that
Let's return to our question about whether the true mean of giraffe heights on Island 1 is less than 11 cm. Our sampling distribution suggests that
Back to the idea that larger samples are "better", we can explore what happens if we redo the groundhog scenario, this time sampling 500 individuals (instead of 50) before taking the mean each time, repeating this until thousands of
samp <- function(n){ x <- rnorm(n, 9.7, 2.1) m <- mean(x) s <- sd(x) return(c(m,s)) }
d <- as.data.frame(do.call(rbind, lapply(1:1000, function(x) samp(5)))) #d2 <- as.data.frame(do.call(rbind, lapply(1:1000, function(x) samp(50)))) d3<- as.data.frame(do.call(rbind, lapply(1:1000, function(x) samp(500)))) colnames(d) <- colnames(d2) <- colnames(d3) <- c("mean", "sd")
p <- ggplot(data = d, aes(x = mean)) + geom_histogram(binwidth = 0.06, color = "white", fill="green3") + theme_light() + scale_y_continuous(expand = c(0,0)) + labs(x = "Sample means N=5", y = NULL) + theme(panel.border = element_blank(), panel.grid.minor = element_blank(), legend.position = , legend.background = ) + xlim(6.7,12.7)
p2 <- ggplot(data = dhh[[1000]], aes(x = Height)) + geom_histogram(binwidth = 0.06, color = "white", fill="green3") + theme_light() + scale_y_continuous(expand = c(0,0)) + labs(x="Sample means N=50", y="Frequency") + theme(panel.border = element_blank(), panel.grid.minor = element_blank(), legend.position = , legend.background = ) + xlim(6.7,12.7)
p3 <- ggplot(data = d3, aes(x = mean)) + geom_histogram(binwidth = 0.06, color = "white", fill="green3") + theme_light() + scale_y_continuous(expand = c(0,0)) + labs(x="Sample means N=500", y = NULL) + theme(panel.border = element_blank(), panel.grid.minor = element_blank(), legend.position = , legend.background = ) + xlim(6.7, 12.7)
cowplot::plot_grid(p3,p2,p, ncol = 1, align = "hv")
</center>
What do we notice?
1) All histograms look normal.
2) All distributions have approximately the same mean.
3) Distributions generated from larger samples are less dispersed.
We can take the mean of the sampling distribution itself-- **the mean of the sampling distribution is a mean of means.** This mean can be interpreted to be the same as a mean that would have resulted from a single large sample, made up of all the individual observations from each of the samples whose ${\bar{x}}$ values are included in the sampling distribution.
Note that if we had only generated a sampling distribution made up of samples of 5 giraffes, we would not have been able to exclude 11 cm as a possible value for ${\mu}$. In fact, if we were to draw a vertical line in the middle of each of the sampling distributions (the mean), we can tell that the population mean is likely even less than 10 cm.
In the following window, you will test the relationship between sampling distribution and sample size. The function below (behind-the-scenes code not shown) will plot a sampling distribution made up of 1000 samples, with each sample containing `N` number of observations. Try setting `N` to a few different values. What does the resulting sampling distribution looks like? See if you can confirm for yourself that the above points are true.
<!---LEARNR EX 1-->
<iframe class="interactive" id="myIframe1" src="https://tinystats.shinyapps.io/06-standardError-ex1/" scrolling="no" frameborder="no"></iframe>
<!------------->
# Standard Error of the Mean
As we've done before, we want to summarize this spread of mean estimates with a single value. We've already learned how to quantify a measure of spread--the standard deviation. If we take the standard deviations of each of the three different sampling scenarios above, then we accept that *distributions based on smaller samples should have larger standard deviations*.
In the window below, calculate the standard deviation of each of the three sampling distributions (i.e. for N = 500, N = 50, and N = 5), and confirm that the italicized point above is true. (If you're working in R locally, use your "homemade" standard deviation function from the [Variance](04_variance.html) module.)
To complete this exercise, you will need to use the objects `sampling_distribution_N500`, `sampling_distribution_N50`, `sampling_distribution_N5`, which are vectors storing the thousands of ${\bar{x}}$ values from the corresponding groundhog sampling distributions.
<!---LEARNR EX 2-->
<iframe class="interactive" id="myIframe2" src="https://tinystats.shinyapps.io/06-standardError-ex2/" scrolling="no" frameborder="no"></iframe>
<!------------->
When you calculate the standard deviation of a sampling distribution of ${\bar{x}}$ values, you are calculating the **standard error of the mean (SEM)**, or just "standard error". The SEM is the value that we use to capture the level of precision of our sample estimate. But, we need a better and more efficient way to arrive at this value without relying on a groundhog day situation. Keep reading to learn more.
<div class= "alert alert-note">
> **A note about SEM:** Here "standard error" will imply standard error of the *mean*. But we can technically calculate the standard error of any sample statistic, not just the mean. We'll talk about that more in future modules.
</div>
# Time for a tea break!
<center>{width=800px}</center>
# Standard error in practice
Deriving the equation used for calculating the standard error of the mean using theory (i.e. without going out and resampling MANY times) is a bit complicated, but if you're interested, you can learn more about it [here](https://stats.stackexchange.com/questions/89154/general-method-for-deriving-the-standard-error). Instead, we can capture the relationship between **standard deviation**, **sample size**, and **standard error** with the plot below.
<center>
```{r, tut=FALSE, echo=FALSE, message= FALSE, warning=FALSE, out.height=2, cache = TRUE, fig.align="center"}
d <- data.frame(N = seq(5, 1000, 5), sd = 2.1)
d$sterr <- d$sd/sqrt(d$N)
d %>%
plot_ly(
width = 600,
height = 350,
type = 'scatter',
mode ='markers',
x = ~N,
y = ~sterr,
marker = list(size = 10, opacity = 0.75),
hoverinfo = "text",
text=~paste("Standard Error:", round(sterr, 3), "\nN:", round(N, 1))
)%>%
config(displayModeBar = F) %>%
layout(autosize = F, width = 600, height = 350,
xaxis = list(zeroline = F),
yaxis = list(title = "Standard Error", zeroline = F)
)
The standard deviation in this plot is 2.1, which represents
Can you figure out what the equation is for the SEM? Look at the plot above, hover over the points, and see if you can gather how standard error of the mean, standard deviation, and sample size are related. Here are some hints:
- SEM will be on one side of the equation, standard devation, and N will be on the other.
- The equation will involve division.
- There is one more missing piece of the puzzle: When you look at the shape of the plot above. What type of function does this remind you of? We haven't covered this explicitly, but take a look here and see if you get any ideas.
Use the window below as a calculator to see if you can figure out the equation for the SEM.
<iframe class="interactive" id="myIframe3" src="https://tinystats.shinyapps.io/06-standardError-ex3/" scrolling="no" frameborder="no"></iframe>In case you weren't able to figure it out, remember to check the Solutions tab in the exercise window or take a look at this link for the equation for calculating the SEM. Recall that we're working with the sample (and not population) standard deviation (
Let's test out the SEM equation on our original sample of heights_island1 and compare it to what we would have gotten by taking the standard deviation of the sampling distribution example with the N= 50 case. Does the SEM seem like a good approximation of the standard deviation of the sampling distribution?
Below, you will use the object heights_island1, which contains our single sample of N=50, and the object sampling_distribution_N50, which contains the data from the corresponding groundhog sampling distribution.
Close enough! We wouldn't expect these to be exactly the same because of sampling variability.
Now that we have a better understanding of how to gauge the precision of our sample estimates, we can test our question about the
To formally make inferences, we need to revisit the principles of the empirical rule to construct confidence intervals. (Confidence intervals are just one way to make inferences-- we'll discuss other ways later.)
Remember, that the SEM is just the standard deviation of the sampling distribution, so we can apply the empirical rule. As a result, ± 2 SEM from a point estimate will capture ~95% of the sampling distribution. Actually, we were a little bit sloppy earlier when we said 2 standard deviations captures 95% of a normal distribution; this will actually give you 95.45% of the data. The true value is 1.96 standard deviations--and this is what we use to construct a 95% confidence interval (CI).
Loosely speaking, a 95% CI is the range of values that we are 95% confident contains the true mean of the population. We want to know whether our guess of 11 cm falls outside of this range of certainty. If it does -- we can be sure enough that the true
Use the window below to find out and make your first inference by constructing the 95% CI for the heights_island1 mean estimate!
The upper limit of our 95% CI is less than 11 cm, so the population mean of heights on island 1 is likely less than 11 cm. In the scientific community, this is a bonafide way of drawing this conclusion.
{width=600px}We've been a little fast and loose with our words. The formal definition of CIs is the following:
If we were to sample over and over again, then 95% of the time the CIs would contain the true mean.
Importantly, some examples of what the 95% CI does NOT mean are:
- A 95% CI does not mean that it contains 95% of the sample data.
- A CI is not a definitive range of likely values for the sample statistic, but you can think of it as estimate of likely values for the population parameter.
- It does not mean that values outside of the 95% CI have a 5% chance of being the true mean.
The precise interpretation of CIs is quite a nuanced and rather hotly debated topic see here and becomes somewhat philosophical-- so if these definition subtleties seem confusing, don't feel bad. As mentioned in the blog post linked above, one recent paper reported that 97% of surveyed researchers endorsed at least one misconception (out of 6) about CIs.
<script> iFrameResize({}, ".interactive"); </script>title: "t-test" output: bookdown::html_document2: includes: in_header: assets/07_tTest_image.html after_body: assets/foot.html
:::obj Module learning objectives
- Determine how to quantify the uncertainty of an estimate
- Describe the concept of statistical inference
:::
You'd like to make an inference to formally investigate whether you have any reason to believe that the mean of heights on Island 1 differs from the mean of the heights on Island 2.
The means of the heights of both islands are shown below:
set.seed(12)
heights_island1 <- rnorm(50, 10, 2)
heights_island2 <- rnorm(50, 18, 1.2)
mean(heights_island1)
mean(heights_island2)
It's obvious that the mean of the two samples we took are different, but the main question is if the population means are different?
This question is of interest because if the two population means are different, it may indicate that a cool evolutionary story is at play. For example, based on your experience it seems clear that the two groups of giraffes have been isolated. Their tiny stature would make it near impossible to move back and forth between the two islands, hence impeding mixing between the two groups. Over time, selection pressures could then have made the two groups distinct regarding height.
How do we test this?
When testing for group mean differenes, [it is much more common for a researcher to be interested in the difference between means than in the specific values of the means themselves. ] stolen
When we focus on the mean difference, represented by
The sample mean difference is below:
mean(heights_island2) - mean(heights_island1)
This is just another estimate at the sample level whose precision we need to quantify to be able to make inferences.
Formally, statistical inference is about testing hypotheses (which we intentionally did not introduce in the previous module). In research, a hypothesis is a statement of a suggested outcome for a study [THIS SENTENCE IS TOO VAGUE]. The goal of statistcal inference is to reject the null hypotheses (
Our null hypothesis is the following: the mean difference between the two populations is 0. The corresponding equations are shown below for the null and alternative hypotheses. Here, we use
One way to reject the null hypothesis would be to construct 95% CIs around the estimate for
As we learned previously, a prerequisite to calculating 95% CIs is to calculate the standard error (which we know will require the sample standard deviation). However, we're now working with two samples, so which sample's standard deviation do we use? Can we use both?
In this particular case, the standard error of the mean difference can be calculated based on a combined, or pooled standard deviation (
One thing to point out is that standard deviations from samples cannot be added together -- but variances can be, which is why in (1) we use
We see that the variances are being multiplied by a term containing the sample size (
If you're wondering why
tutorial::go_interactive(height = 160)
[DATA CAMP WINDOW WHERE THEY WILL CALCULATE THE S_P OF THE DATA]
After calculating the pooled standard deviation, the next step is to determine the standard error of the mean difference. We will follow the same logic as we did when calculated the standard error based on a single sample -- except now we will use the pooled standard deviation. Again, we will be adding the terms from the two samples together, so to be able to sum these we need to use the pooled variance (the square of the pooled standard deviation.)
[ annotated?]
\begin{equation} (\#eq:equation2) \Large SE_{({\bar{x_1}-\bar{x_2})}} = \sqrt{\frac{s_p^2}{n_1} + {\frac{s_p^2}{n_2}}} \end{equation}[DATA CAMP WINDOW WHERE THEY WILL CALCULATE THE SE OF THE MEAN DIFF]
Now that you know the standard error, you are ready to construct the 95% CI around the mean difference. As before, this will be the mean difference plus/minus 1.96 *
Now we can see whether or not our null hypothesis can be rejected. If the 95% CI for values of
[Construct interval for yourself below, DATA CAMP, INSTRUCTIONS]
tutorial::go_interactive(height = 160)
set.seed(12)

heights_island1 <- rnorm(50,10,2)
heights_island2 <- rnorm(50, 18, 1.2)
# Calculate the mean diff

mean_diff <-

# Calculate the Sp for heights_island1 and heights_island2
Sp <-

# Calculate the SE_meandiff
SE_meandiff <-

# Add ± 1.96 SEM to the sample mean to construct the upper and lower bounds of the 95% CI

upperCI <-
lowerCI <-

meandiff_95CI <- c(lowerCI, upperCI)
meandiff_95CI
# Calculate the mean difference
mean_diff <-  mean(heights_island2) - mean(heights_island1)

# Calculate the Sp for heights_island1 and heights_island2
N1=50
N2=50

Sp <- sqrt(((sd(heights_island1)^2)*(N1-1) + (sd(heights_island2)^2)*(N2-1))/((N1-1)+(N2-1)))

Sp <- sqrt((var(heights_island1)*(49) + var(heights_island2)*(49))/(N1+N2-2))

# Calculate the SE_meandiff

SE_meandiff <- sqrt(Sp^2/N1 + Sp^2/N2)

# Add ± 1.96 SEM to the sample mean to construct the upper and lower bounds of the 95% CI

upperCI <- mean_diff + 1.96*SE_meandiff
lowerCI <-  mean_diff - 1.96*SE_meandiff

meandiff_95CI <- c(lowerCI, upperCI)
meandiff_95CI
Our 95% CI does not include 0 by a lot! So we can conclude that the population means from Island 1 and Island 2 are mostly likely distinct. In other words, we can reject
[T test function will calculate the 95CI using the t distribution @ 97.5%m, which doesn't always give 1.96]
Even though CIs are great tools for inference, you are probably most familiar with seeing p-values in scientific literature. The p-value that is output from your statistical test gives you a metric that tells you whether or not your results are statistically significant. Typically, p-values < 0.05 meet this criterion.
The "p" in p-value stands for "probability". Probability of what? The p-value is the probability that you would have gotten your results or something more extreme if in fact the null hypothesis were true. "More extreme", in this case, would be a mean difference even greater than what we see in the present data. The lower the p-value, the less likely you'd be getting your results due to chance alone.
Now let's derive the p-value for the mean difference of the two island heights, and make sure that we can draw the same conclusion that we did when we used the 95% CI for inference. In order to do this, we will use a statistical test for comparing two groups: the t-test.
The t-test is all about the t-statistic, which is produced when the mean difference is divided by the standard error. When we divide by the standard error, we turn our mean difference estimate into a unitless metric that is not dependent on the scale that means were recorded with (i.e. centimeters). Furthermore, dividing by the standard error also will also account for the uncertainty in the estimate.
- The t-statistic is essentially combining whatever our sample estimate is (e.g. mean difference, sample mean, etc.) and its uncertainty (i.e. standard error) into one value.
- we convert the t-statistic into a p-value via the a specific kind of distribution called the t-distribution. [plot, here's an example of one]
- the further out in the tails of the t-distribution that the t-statistic falls. The lower the pvalue will be.
(3) Degrees of freedom; Hasse has some ideas. (4) A formal definition of hypothesis including null hypothesis.
Implement, and then formally answer the question.
- You know the final answer of a single estimate. You can pick whatever you want, until you're down to the last choice....then you don't have the "freedom". --> explains why we use Total -1 = DF.
- Explain Whyyyyyyyyy we need it.
- The t-distribution will look different depending on the degrees of freedom
Intermediate step here between CI and p-values. T-test statistic greater than 1.96 will result in a significant p-value.
Write your own t-test function.
Start with same N, but then “to make it a more useful model, you need to be able to handle when the sample sizes are not the same.”
Unequal variance: more fodder for things to think about
layout
:::: {.columns}
::: {.column width="40%"}
#| output-location: column-fragment
#| code-line-numbers: "|2"

library(ggplot2)

mtcars |>
  ggplot(aes(x = disp, y = mpg)) +
  geom_point() +
  geom_smooth(method = "loess", formula = "y~x")
:::
::: {.column width="60%"} contents... podemos cambiar por slide [red words]{style="color:#cc0000"} :::
::::
::::: {.columns}
:::: {.column width="50%"}
::: {.fragment}
::: {.incremental}
- Make
- Your
- List :::
:::
::::
:::: {.column width="50%"}
::: {.fragment}
#| echo: fenced
head(mtcars)