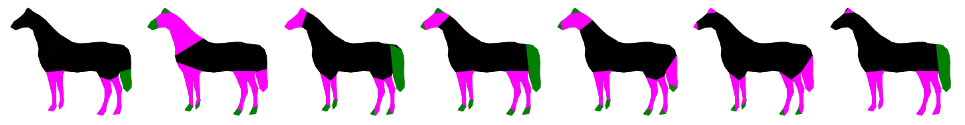
One of the most whimsical pastimes is cloud-watching, where we can find dragons, castles, even spaceships among the clouds. But how do we recognize these clouds as distinct shapes? To explore this question, we used an open access database for 2D shape structure investigation compiled by Carlier, Leonard, Hahmann, Morin, and Collins. The researchers presented users with a variety of shapes and asked them to deconstruct the shape into the main shape, 1-2 levels of subparts, and details. Users indicated these regions by using four different colors with each color representing the importance of that part to defining the whole shape - in essence, defining a hierarchy. The researchers referred to these recolored images as annotations. Our project took this a step further by investigating whether we could use machine learning to sort users into categories. We noticed that some users simply annotated the shapes like they were coloring in a coloring book rather than creating a reasonable shape hierarchy. We wanted to remove these "artists" from the dataset but did not want to comb through all 42,0000 annotations by hand. Ultimately we used k-means clustering to see if an unsupervised learning model could identify artists as a cluster, and perhaps create further distinctions in the dataset we were unaware of.
See project-report.pdf for a more comphrensive explanation of the project and visit the shape database site to learn more about the original research study.
The database contains 1,255 different types of shapes with 2,861 different users annotating the shapes. Not every user annotated every shape, so there is variability in the types of annotations. Each annotation is a string of digits from 0 to 3, and each number represents one of the four colors users utilized to represent the shape hierarchy. Each shape had at least 24 annotations.
Example annotations (taken from database website):
-
clusters
- ... # random samples from each cluster
-
images
- ... # each annotation from random samples from each cluster
-
JSON
- ... # JSON shape files
-
our_clusters
- ... # example clusters
-
annotationTable.csv
-
dataset.mat
-
displayShape.m
-
extractFeatures.m
-
featureData.mat
-
readJSON.m
-
runMe.m
- MATLAB R2018b or later
Run the runMe.m file and wait for results. The amount of clusters is currently set to 5, but this can be changed to any number up to 9.
Expected output: the MATLAB console will display model parameters and cluster data.
*There are NO popup figures; we suppressed the popups because of the size of the dataset, but the PNG files are created inside the appropriate folders for viewing later
Data files: dataset.mat, annotationTable.csv
MATLAB function to run: runMe.m
>> runMe
    Building k-means clustering model. Please hold, this will take a while...
    Parameters: k = 4, repetitions = 10, samples = 49, max iterations: 100

    Replicate 1, 66 iterations, total sum of distances = 2991.77.
    Replicate 2, 76 iterations, total sum of distances = 2991.77.
    Replicate 3, 68 iterations, total sum of distances = 2991.78.
    Replicate 4, 54 iterations, total sum of distances = 2991.77.
    Replicate 5, 71 iterations, total sum of distances = 2991.77.
    Replicate 6, 28 iterations, total sum of distances = 2991.78.
    Replicate 7, 86 iterations, total sum of distances = 2991.78.
    Replicate 8, 21 iterations, total sum of distances = 3400.97.
    Replicate 9, 53 iterations, total sum of distances = 2991.78.
    Replicate 10, 78 iterations, total sum of distances = 2991.78.
    Best total sum of distances = 2991.77
    Current cluster: k4-cluster1
    Current cluster: k4-cluster2
    Current cluster: k4-cluster3
    Current cluster: k4-cluster4
    Centroid locations:
        0.4726    0.3853    0.1437    0.0465    0.3219
        0.9088    0.0866    0.0568    0.0046    0.1193
        0.2472    0.2685    0.5262    0.0235    0.3662
        0.2184    0.7118    0.0974    0.0125    0.2498

    You made it to the end of the script! Yay!
>>
- Sara Bawale
- Caroline Dahl
- Giuliana Zanutta
Original research study:
- Axel Carlier
- Kathryn Leonard
- Stefanie Hahmann
- Géraldine Morin
- Misha Collins
- Many thanks to professor Kathryn Leonard for the support in developing this project
- Thank you to Billie Thompson - PurpleBooth for providing the the template for this README file