A real-time monitoring tool for Apache Kafka that displays consumer lag and event rates in a clean, top-like interface.
kafkatop provides a simple, yet powerful, way to quickly view the health of your Kafka consumers and topics. It helps you identify bottlenecks and diagnose issues with consumer lag in real-time, directly from your terminal.
 Anonymized topics and groups
- Real-time Monitoring: Keep an eye on event consumption and production rates across your Kafka broker.
- Consumer Lag & ETA: Instantly see the lag for each consumer group and topic, with an estimated time to catch up.
- Flexible Filtering: Easily filter by topic or consumer group name, and focus on problematic groups with a dedicated flag.
- JSON Output: Export the current status as a JSON object, for integrating with batch-collecting monitoring and alerting systems.
- Anonymization Mode: Anonymize topic and group names when sharing your screen or logs.
- Metadata Reporting: Export an overview of consumer and topic metadata (topics, partitions, ISR, leaders) in JSON.
Download the single-file pex executable from the releases page. It's compatible with X86 64-bit systems and requires Python 3.9–3.13 in your path.
This is the easiest way to distribute, although startup time might be bit higher.
Install with pip:
pip install kafkatop
Install inside a virtualenv (recommended practice):
python3 -m venv virtual_env # this will create a 'virtual_env' directory
. bin/virtual_env/activate  # 'activate' the virtualenv. Run 'deactivate' to deactivate.
pip install --upgrade pip   # can produce errors otherwise
pip install kafkatop        # install kafkatop
kafkatop                    # run
To get started, simply run kafkatop specifying the address of a Kafka broker if needed:
kafkatop
Monitor a specific consumer group:
kafkatop --kafka-broker 10.227.1.110 --group-filter-pattern '.*group_name.*'
Monitor kafka running in kubernetes, from the kubernetes node
# Port-forward the pod's port locally in another terminal, or in the background:
timeout 1200 kubectl port-forward kafka-0 9092:9092 &

# Run kafkatop on the node
kafkatop
usage: kafkatop.py [-h] [--kafka-broker KAFKA_BROKER] [--text] [--poll-period KAFKA_POLL_PERIOD] [--poll-iterations KAFKA_POLL_ITERATIONS] [--group-exclude-pattern KAFKA_GROUP_EXCLUDE_PATTERN]
                   [--group-filter-pattern KAFKA_GROUP_FILTER_PATTERN] [--status] [--summary] [--summary-json] [--topicinfo] [--topicinfo-parts] [--only-issues] [--anonymize] [--all]
                   [--version]

Kafka consumer statistics

options:
  -h, --help            show this help message and exit
  --kafka-broker KAFKA_BROKER
                        Broker IP (default: localhost)
  --text                Only plain text, no rich output. (default: False)
  --poll-period KAFKA_POLL_PERIOD
                        Kafka offset poll period (seconds) for evts/sec calculation (default: 5)
  --poll-iterations KAFKA_POLL_ITERATIONS
                        How many times to query and display stats. -1 = Inf (default: 15)
  --group-exclude-pattern KAFKA_GROUP_EXCLUDE_PATTERN
                        If group matches regex, exclude (default: None)
  --group-filter-pattern KAFKA_GROUP_FILTER_PATTERN
                        Include *only* the groups which match regex (default: None)
  --status              Report health status in json and exit. (default: False)
  --summary             Display consumer groups, states, topics, partitions, and lags summary. (default: False)
  --summary-json        Display consumer groups, states, topics, partitions, and lags summary, in json. (default: False)
  --topicinfo           Only show informational data about the cluster, topics, partitions, no stats (fast). (default: False)
  --topicinfo-parts     Same as --info but also show data about partitions, isr, leaders. (default: False)
  --only-issues         Only show rows with issues. (default: False)
  --anonymize           Anonymize topics and groups. (default: False)
  --all                 Show groups with no members. (default: False)
  --version             show program's version number and exit
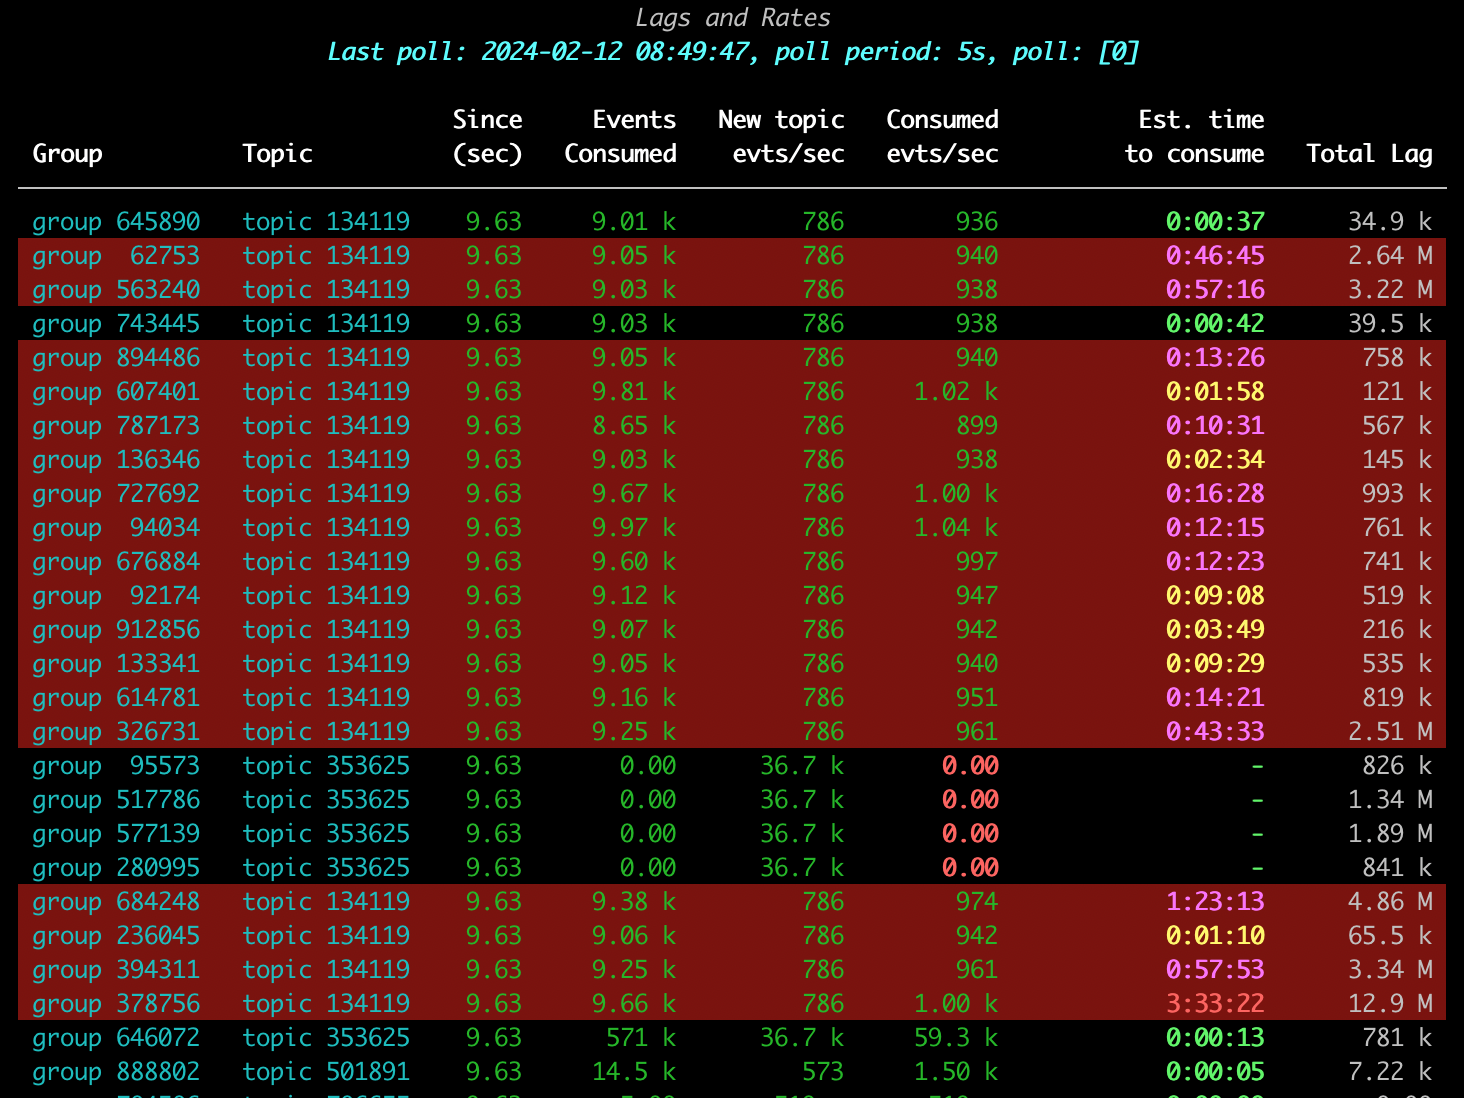 |
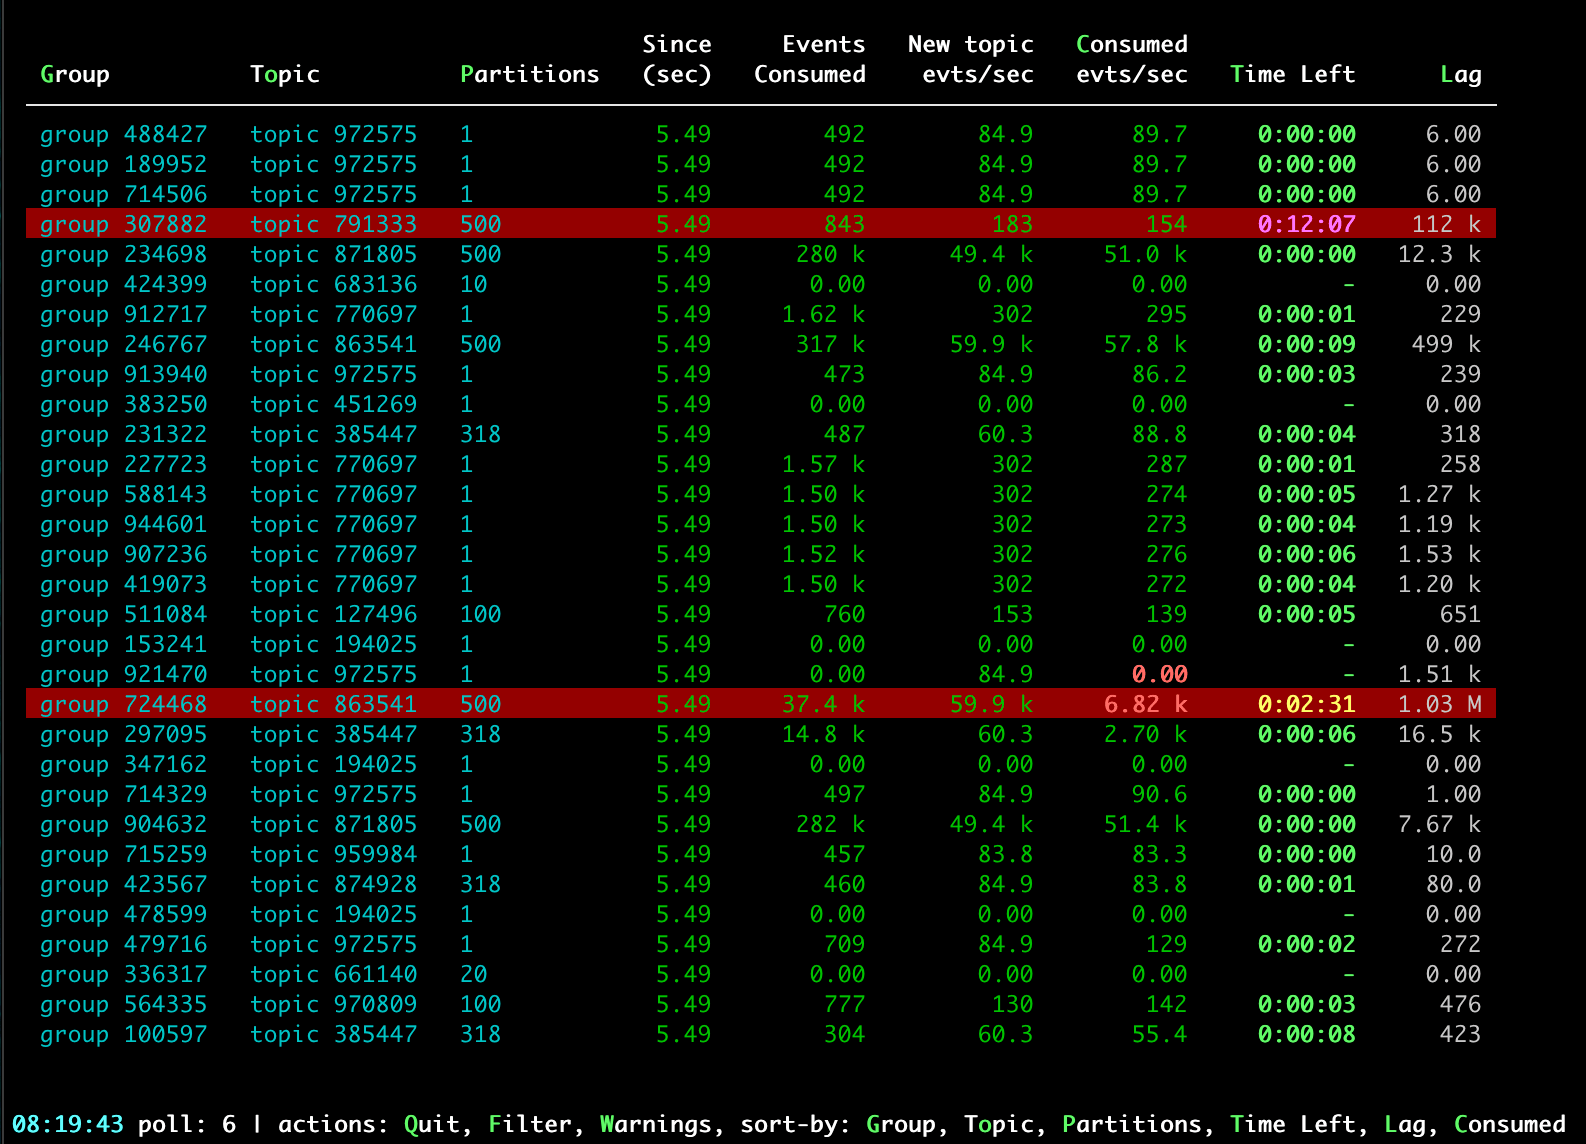
|---|
| In the screenshot above (anonymized topics/groups), highlighted rows indicate the ETA to consume all the lag, with the consuming rate of the last period, is > 1 minute. Red cell fonts on the consumption rate indicate consumption rate is low. Cell colors indicate severity. |
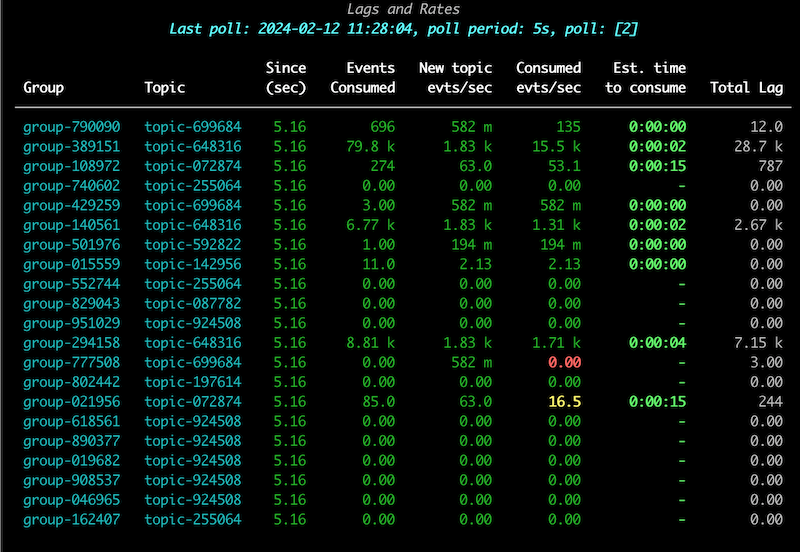 |
|---|
| A healthy system. |
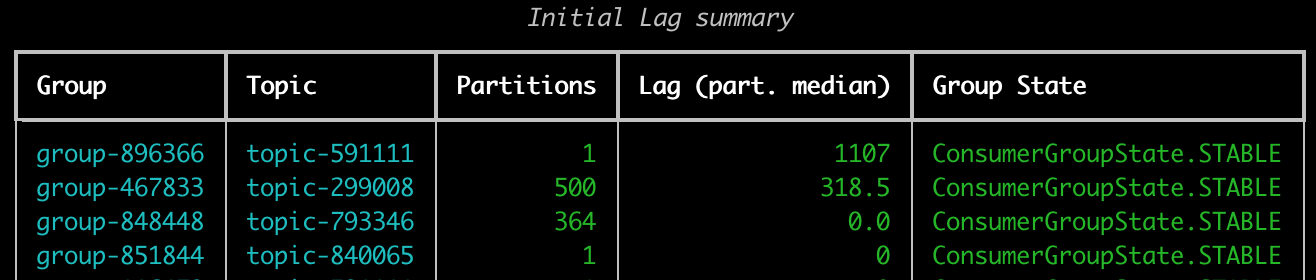 |
|---|
| A summary of (anonymized) groups, topics, partitions, lag and consumer group states. The lag is the median lag accross all topic partitions. |
A machine-parseable json can be produced as well:
kafkatop --kafka-broker 1.2.3.4 --group-filter-pattern 'GroupName1' --summary-json
results in:
{
  "ConsumerGroupName1": {
    "TopicName": {
      "partitions": 1672,
      "state": "ConsumerGroupState.STABLE",
      "lag_max": 86169242,
      "lag_min": 0
    }
  },
[...]
}
Requires python >=3.9 in your path
- set the full path of PYTHON at the top of Makefile or add the PYTHON= parameter when calling make
makemake pex
make pex
This will create a kafkatop pex executable which will include the python code and library dependencies all in one file. It will need the python3 in the path to run.
If you have multiple python versions on your environment, you can run make-pex-mp.sh to create a kafkatop binary which includes dependencies for all python versions.
This project is licensed under the terms of the MIT license.