-
Notifications
You must be signed in to change notification settings - Fork 33
Setting up InfluxDB and Grafana
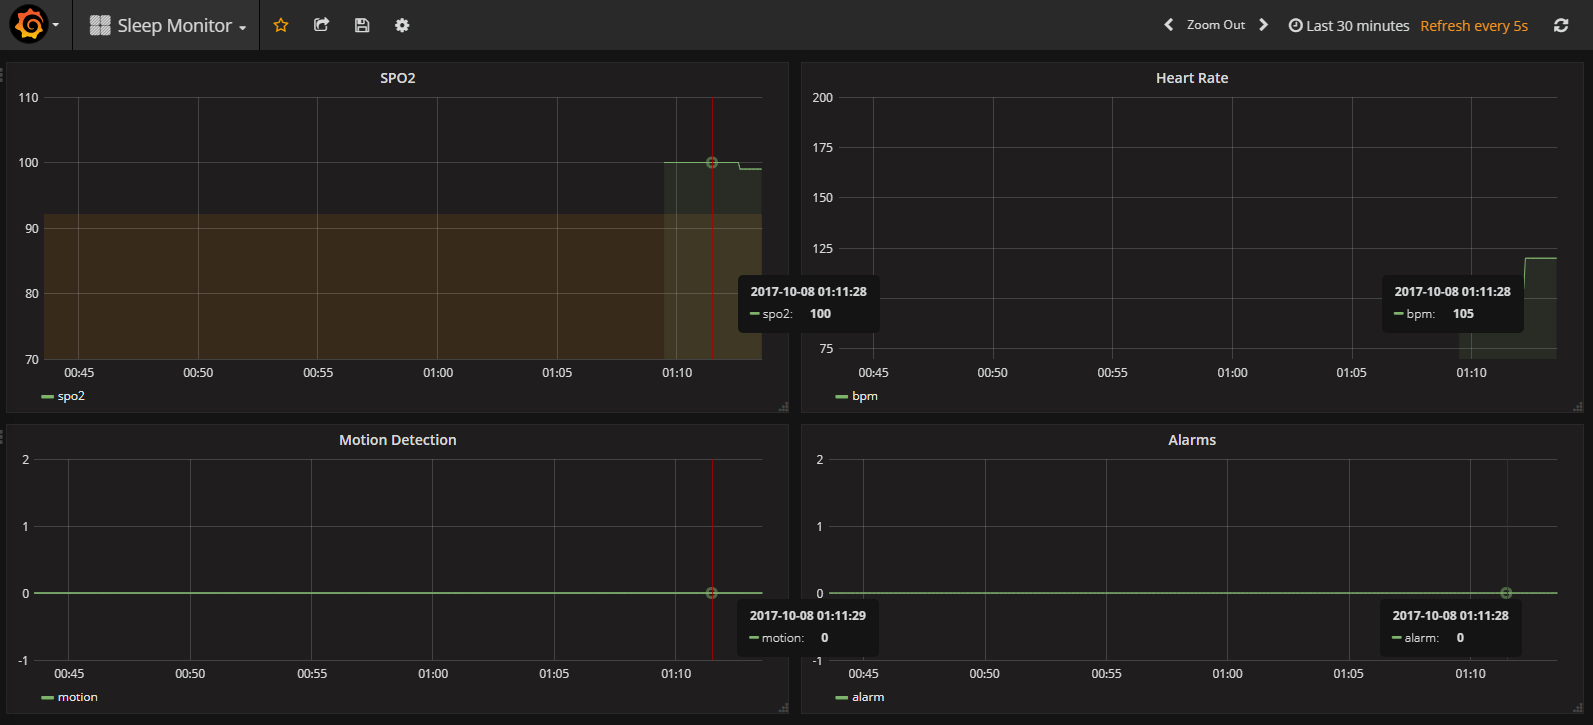
The sleep monitor can optionally be setup to log motion and oximeter sats to an InfluxDB database which can then be visualized by Grafana on any web browser.

To set up this up, run the following script from this repo:
./setup_grafana.sh
NOTE The above script will download and install InfluxDB, Grafana and also configure them according to the setings in this repo. In particular, it will overwrite /etc/influxdb/influxdb.conf using the included file of the same name in this repo. If you have an existing InfluxDB installation, you might want to edit the script above to skip this step. Note that the port numbers of an InfluxDB installation by default will not work with the included datasource file grafana_datasource.json. If you have an existing InfluxDB installation you wish to use, you will need to modify the following files:
-
grafana_datasource.json: Change the port numbers there. -
InfluxDbLogger.py: Change the port numbers and user name/passwords in there.
Once it is setup, you can navigate to:
http://raspberrypi.local:3000/dashboard/db/sleep-monitor?refresh=5s&orgId=1&from=now-30m&to=now
The first time you log into the the URL above, you need to configure the data source to use the URL of the Pi. To do this, sign in with the user name and password of your Grafana server. By default, these are "admin/admin". Then edit the data source called "sleep_monitor". Make sure the URL in HTTP settings says something like "http://192.168.1.13:9001".