Star Schema Design • Raw Data • Creating the Schema • Destroy Schemas • Rebuilding Schemas • Load Data in Bronze • Transform and Load Data in Gold • Business Outcomes • Automated Tests • Setting up the Workflow • Pictures
This project is based around a bike sharing program, that allows riders to purchase a pass at a kiosk or use a mobile application to unlock a bike at stations around the city and use the bike for a specified amount of time. The bikes can be returned to the same station or another station.
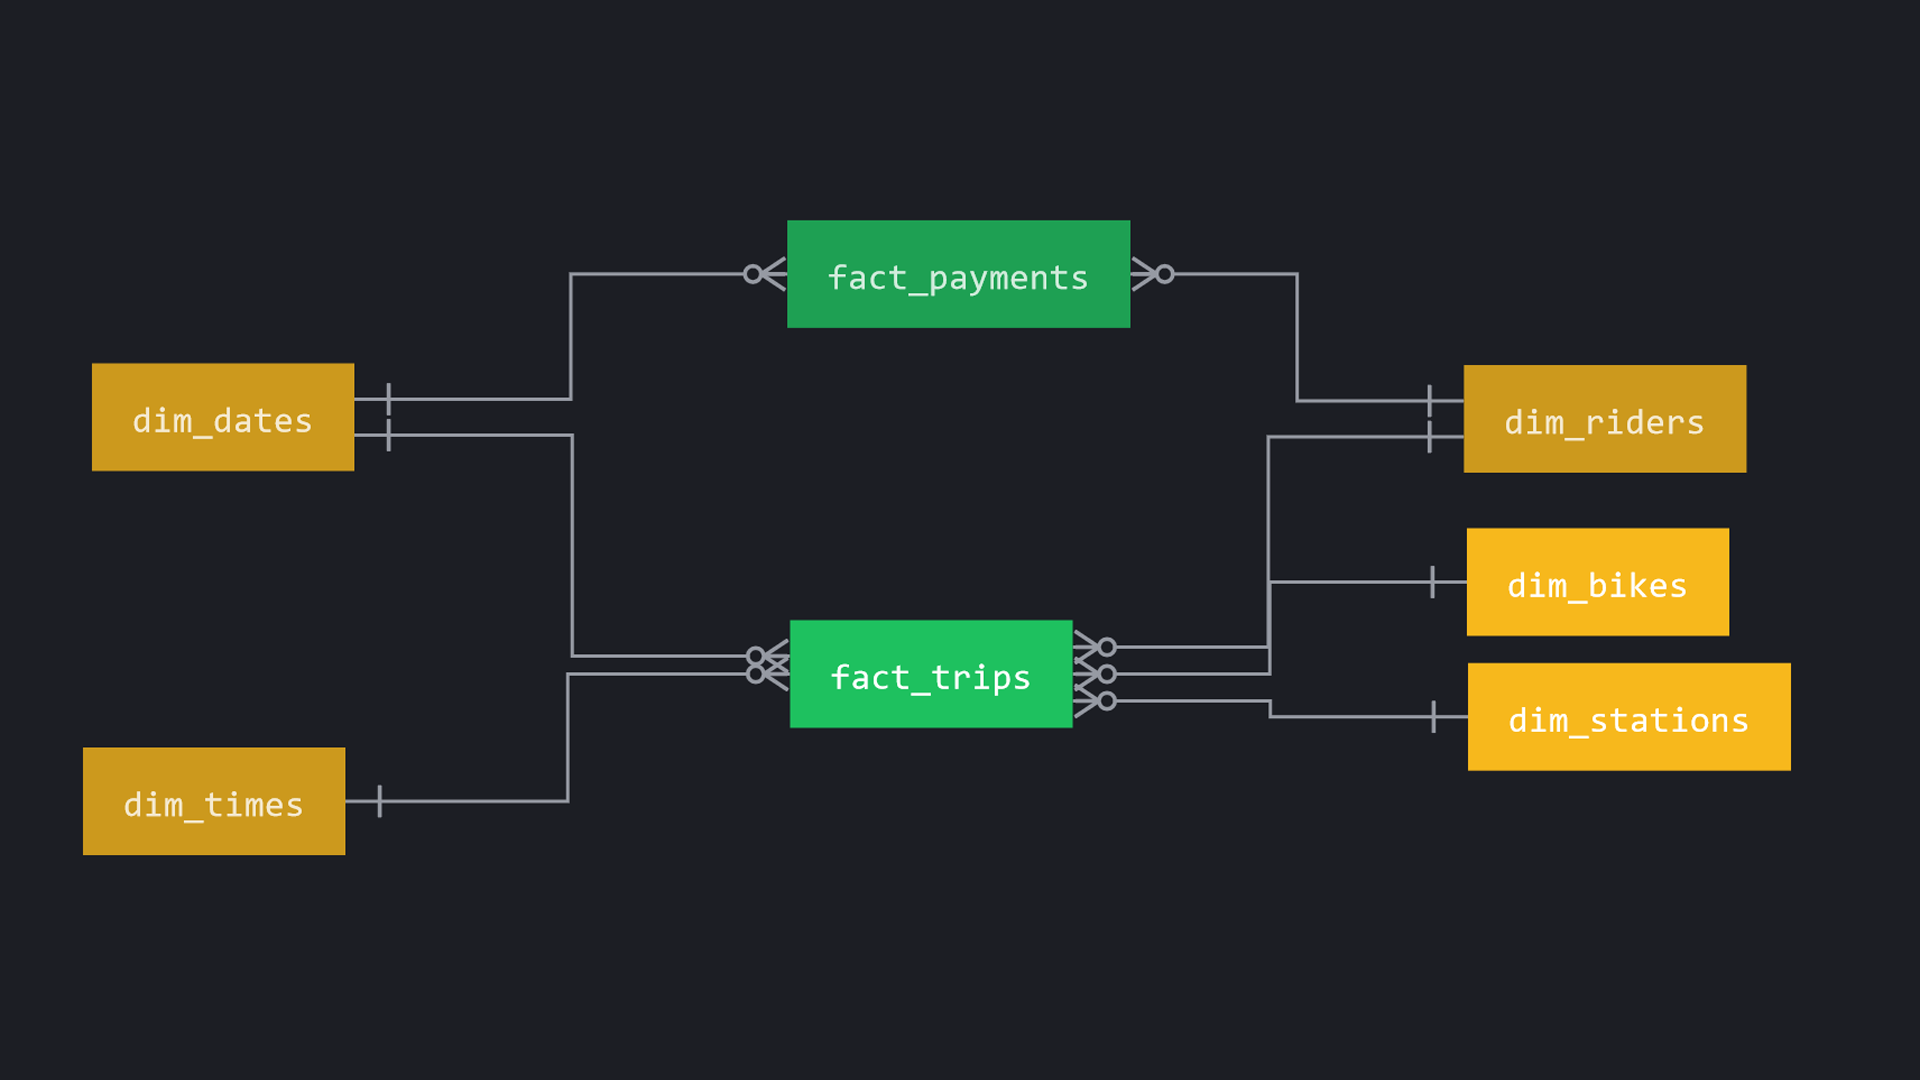
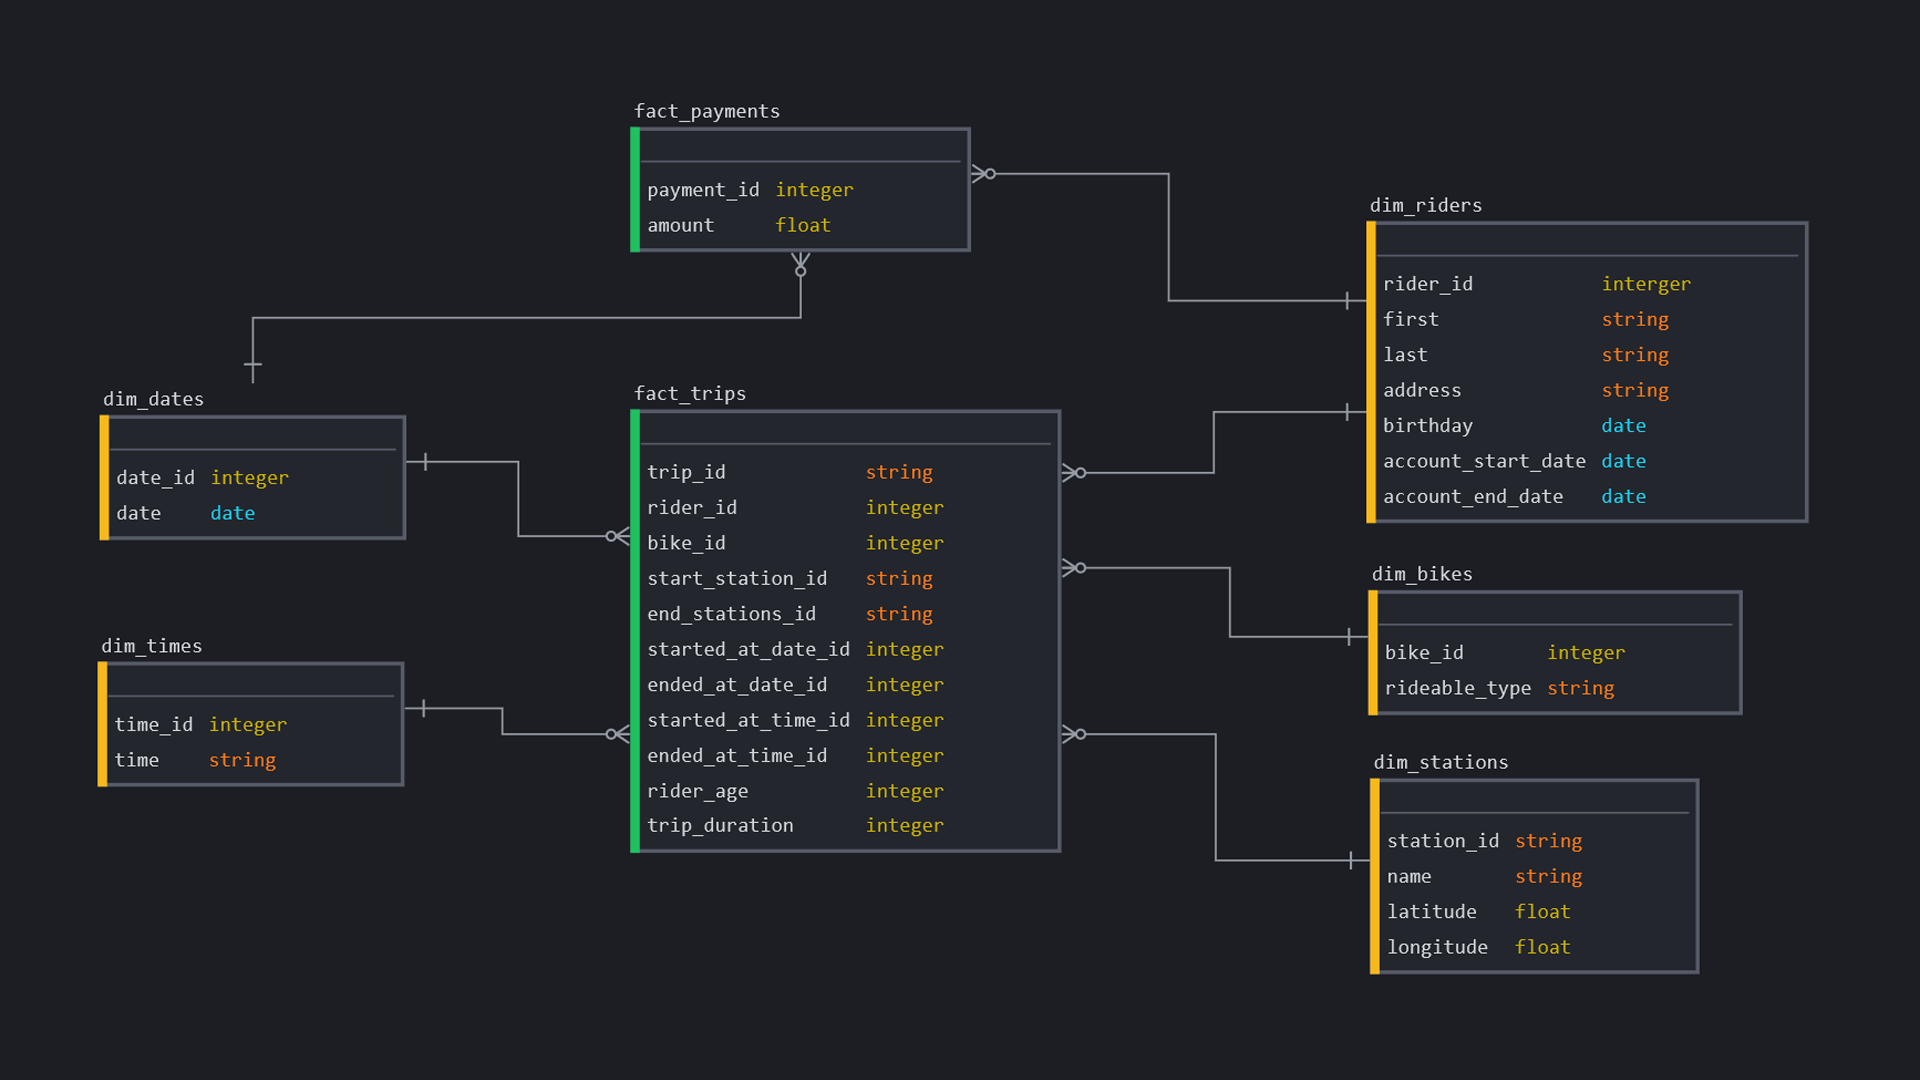
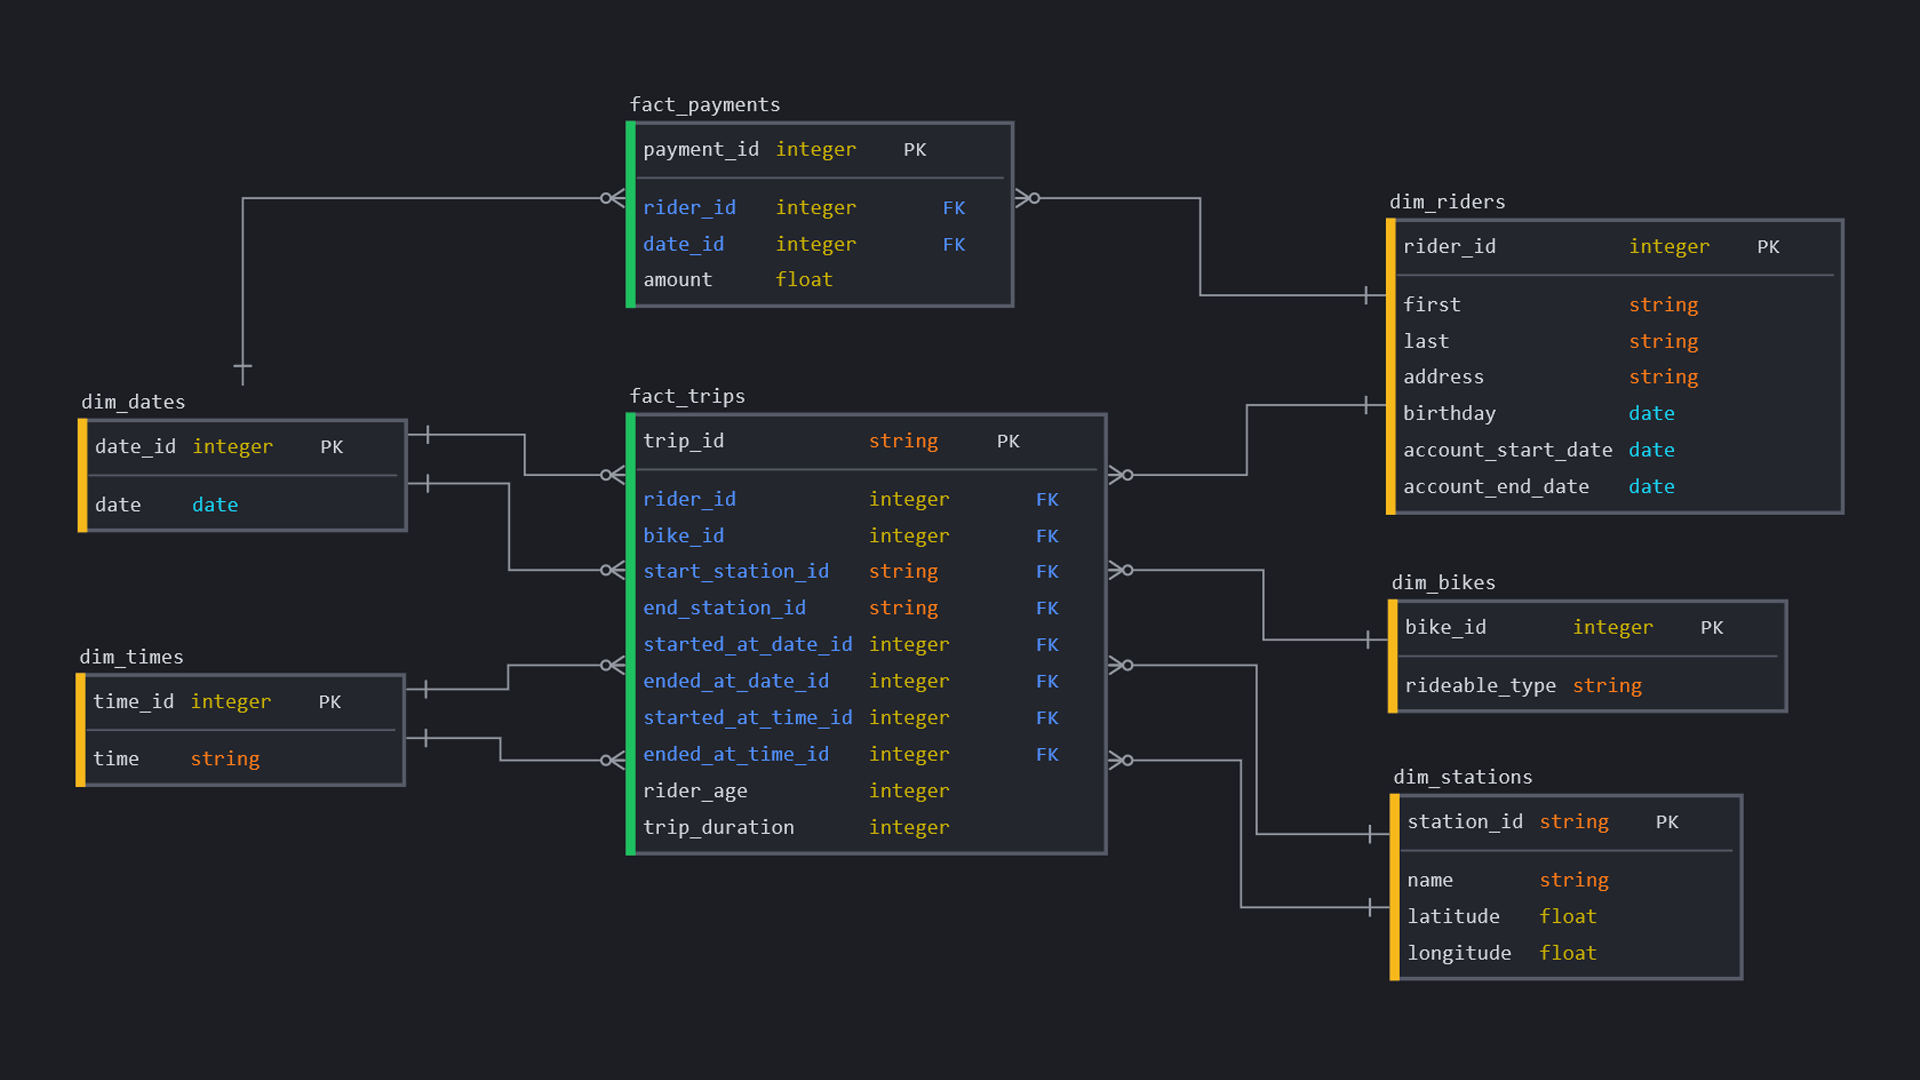
We created a star schema that ingests data into a Bronze layer. The incoming data data in the Bronze layer is then manipulated by enfocing a given schema and saved into the Silver layer. The data in the Silver layer is then transformed into the fact and dimension tables as laid out in the physical database design.
Star schema project files are located within this repository. This repository is designed to run in conjunction with Databricks, and hence, will use the Databricks File System (DBFS) to store each of the medallion layers.
The various stages of the design of the star schema is shown in the various stages below.
Within the repository, there is a folder called zips, contianing the relevant .zip files within. These zips contain the raw data in csv files.
| Zip Files | Contents |
|---|---|
| payments.zip | payments.csv |
| riders.zip | riders.csv |
| stations.zip | stations.csv |
| trips.zip | trips.csv |
Within the repository, the schemas for the each of the tables in each of the layers is written out in the file SchemaCreation.py.
An example of one of these schemas, is written below:
from pyspark.sql.types import *

trips_bronze_schema = StructType ([
    StructField("trip_id", StringType(), True),
    StructField("rideable_type", StringType(), True),
    StructField("started_at", StringType(), True),
    StructField("ended_at", StringType(), True),
    StructField("start_station_id", StringType(), True),
    StructField("end_station_id", StringType(), True),
    StructField("rider_id", StringType(), True),
])This notebook deletes any databases already located in the DBFS. An example of this is shown below:
dbutils.fs.rm("/tmp/Steven/Bronze", True)This notebook creates empty dataframes in each layer, using the schema located in the SchemaCreations.py. An example of this is shown below:
from pyspark.sql.types import *

empty_rdd = sc.emptyRDD()

bronze_trips_df = spark.createDataFrame(empty_rdd, trips_bronze_schema)
bronze_trips_df.write.format("delta").mode("overwrite").save("/tmp/Steven/Bronze/trips")The notebook called Bronze does a few tasks. Below is a summary:
Pulls the zips folder from the repository to the Github folder in DBFS
!wget "https://github.com/steviedas/StarSchemaProject/raw/main/zips/payments.zip" -P "/dbfs/tmp/Steven/Github/"
Unzips the zips file into the Landing folder in DBFS
import subprocess
import glob
zip_files = glob.glob("/dbfs/tmp/Steven/Github/*.zip")
for zip_file in zip_files:
   extract_to_dir = "/dbfs/tmp/Steven/Landing"
   subprocess.call(["unzip", "-d", extract_to_dir, zip_file])
Writes all the CSV's to Bronze as Delta Format
bronze_trips_df = spark.read.format('csv').load("/tmp/Steven/Landing/trips.csv", schema = trips_bronze_schema)
bronze_trips_df.write.format("delta").mode("overwrite").save("/tmp/Steven/Bronze/trips")
The Silver notebook loads the created delta files from tmp/Steven/Bronze and writes them to the empty delta files located in tmp/Steven/Silver
The Gold notebook creates all the facts and dimensions tables as shown in Star Schema design. A list of the tables it creates is shown below:
| Fact Tables | Dimension Tables |
|---|---|
| fact_payments | dim_bikes |
| fact_trips | dim_dates |
| dim_riders | |
| dim_stations | |
| dim_times |
The Business Outcomes notebook answers all the following Business Outcomes:
Analyse how much time is spent per ride:
- Based on date and time factors such as day of week and time of day
- Based on which station is the starting and/or ending station
- Based on age of the rider at time of the day
- Based on whether the rider is a member or a casual rider
Analyse how much money is spent
- Per month, quarter, year
- Per member, based on the age of the rider at account start
EXTRA - Analyse how much money is spent per member
- Based on how many rides the rider averages per month
- Based on how many minutes the rider spends on a bike per month
The AutomatedTests notebook loads the BusinessOutcomes notebook and queries the resultant dataframes. There are several assert statements to check that the business outcomes can be answered using these queries. An example assert is shown below:
# ASSERT 1
assert one_a_week_grouped_df.count() == 7, "This dataframe has an incorrect number of rows"Within Databricks, to get this project to create the whole dataset automatically, follow the steps listed below:
- Clone the repository to your own github account (or ask to be added as a contributor).
- Add the repository to Databricks account (on Databricks Repos > Add Repo)
- Create a Workflow in Databricks (click on Workflows in the left menu bar and click create job). Give each task a name that is suitable and fill out the following:
- Set
TypeasNotebook - Set
SourceasGit provider- click theAdd a git referenceand provide it with theGit repository URLand set a branch - Set the
Path, this should be in this formatfinal_notebook/<NotebookName> - Save the task
- Set
- Repeat step 3 for all the relevant notebooks. Add the notebooks located within the repository to the workflow in this order:
DestroySchemasDatabases.pyRebuildSchemasDatabases.pyBronze.pySilver.pyGold.py
- Create/Start/Attach a cluster and run the workflow. After this is done running, you should see within DBFS a file directory as shown in the DBFS File Structure picture.
Pictures of the various file structures created and displays of the several dimension and fact tables, are shown below:


