| Autour | Date |
|---|---|
| Tarek Hassan | May 8 2020 |
This projects aims to predict number of COVID-19 cases in Egypt.
Using daily updated from Johns Hopkins university,
I tried to predict the expected number of COVID-19 ( confirmed - deaths - recovered ) cases with two approches.
- Exponential curve equation
- Logistic curve equation
The day which we will predict the number of cases is May 25 2020.
The data comes with all the countries that have at least 1 confirmed case, so we need to filter Egypt from it
Here is a glimpse of the Egypt confirmed cases data after filtering
| Country | 2020-01-22 | 2020-01-23 | 2020-01-24 | .... | 2020-5-6 |
|---|---|---|---|---|---|
| Egypt | 0 | 0 | 0 | .... | 7588 |
Here is the confirmed cases growth curve in Egypt

We can see by just looking that the growth of number of cases in Egypt is an expoential grwoth. so we can try to find the closest exponential curve that fits into this curve and find what number will be on that curve on May 25.
Using exponential growth equation alpha * exp(beta * t) + theta and R model to find the optimal alpha, beta and theta to find the closest curve fits into the growth curve of Egypt.
#Fitting a model to find the optimum value of theta
  model.0 <- lm(log(Cases - c.0) ~ Date, data = df_t)

  # Finding optimum of alpha, beta and theta
  start <-
    list(a = exp(coef(model.0)[1]),
         b = coef(model.0)[2],
         c = c.0)
  model = nls(
    formula = Cases ~ a * exp(b * Date) + c ,
    data = df_t,
    start = start
  )

  # Storing alpha, beta and theta
  t = coef(model)

  p = t["a"] * (exp(t["b"] * x)) + t["c"]
The expected confirmed cases number on May 25 is about 21,000 case

By trying the same on (death - recovered ) cases ...
the expected deaths cases number on May 25 is about 1000 cases

the expected recovered cases number on May 25 is about 4,500 cases

But there is no continuous exponential growth in real life, because eventualy we will reach a point where there will be so many infected people and less not infected people and the curve will start to slow until it falts when we reach the population,and here comes the logistic curve.
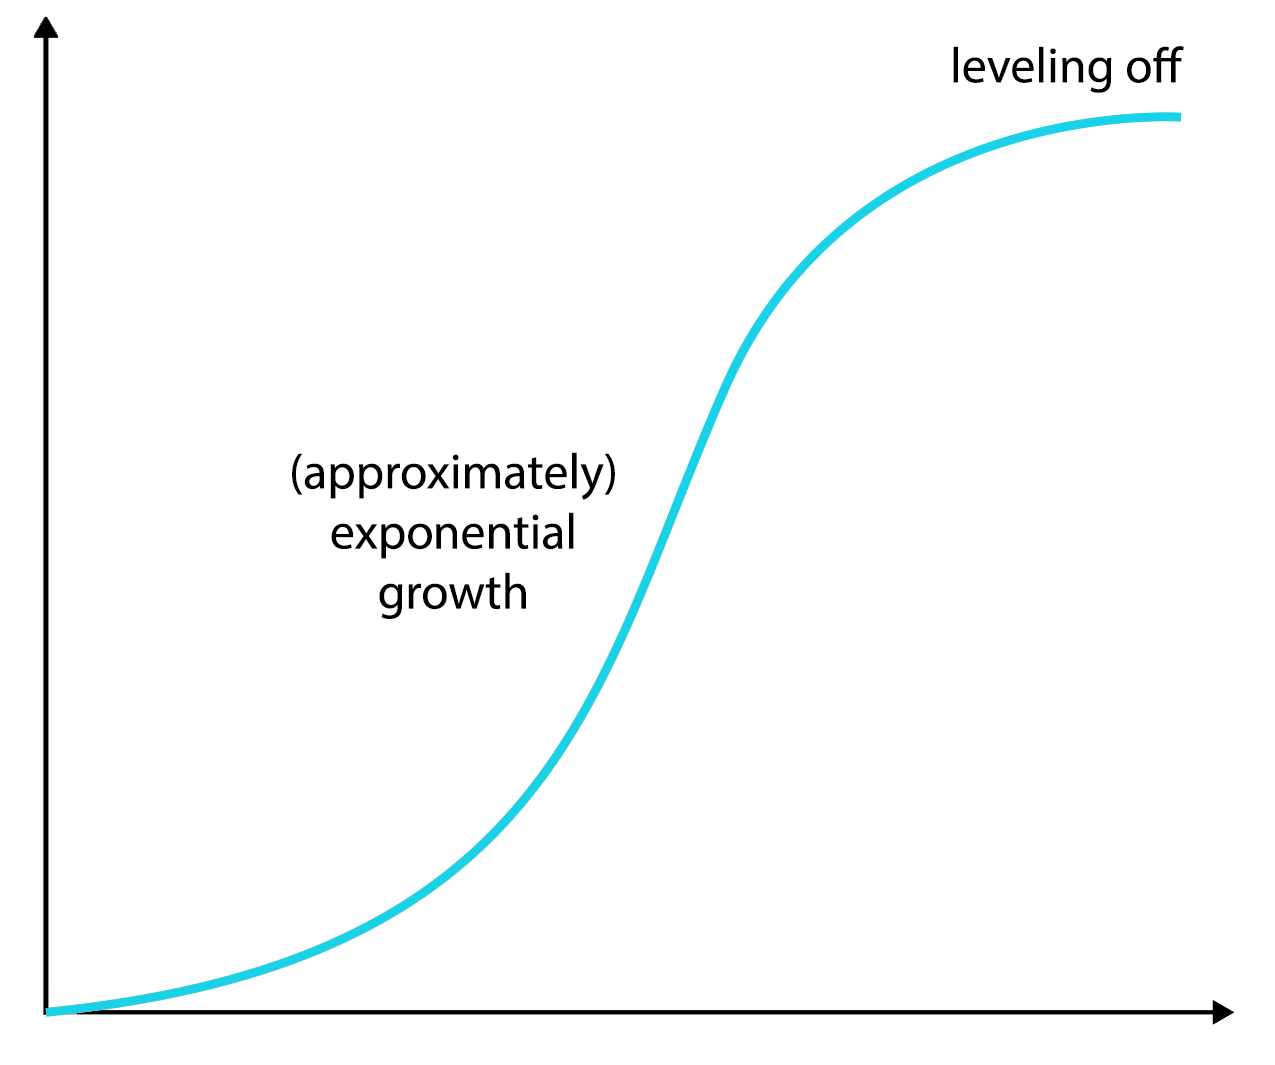
Logistic curve equation is N(d+1) = E * P * N(d) where ...
- N(d+1) : Number of cases in the next day
- E : Average number of people someone infectedd is exposed to every day
- P = (1 - N(d) / Population): Probabilty of each exposure becoming an infection
- N(d) : Number of cases in the current day
and we can see the logistic curve depends mostly on the E and P which together they represent the infection rate, in the begining of the infection the P is high becuase (1- (1 / 98 420 000) ) = 0.9999
We can run something like a simulation by adjusting the E and P.
So by starting from the current dat and by saying that the average number of people someone infected is exposed to every day is 7 we find that the number of confirmed cases on May 25 is about 25,000 cases and if it's 4 because of the quarntine the number is about *15,000

But by starting from the begining of the infection and by saying that the average number of people someone infected is exposed to each day is 7 before the quarntine and 2 after the quarntine. The number of Actual cases on May 25 is about 150,000 cases

You might wonder where is this huge number? Well, by subtracting the predicted confirmed cases on May 25 which is 21,000, the rest "130,000" should be people who got infected and recovered without the need to go to the hospital, and people who got infected and died without knowing they had the virus.