![]()

To read, analyze and plot hyperspectral data from Specim devices. Currently only tested with FX10 data.
- read Specim instrument data
- support for large files thanks to dask
- using xarray for data handling and data analysis
- computation of spectral albedo and braodband albedo if white and dark reference is available
pip install specarrayfrom specarray import SpecArray
from pathlib import Path
import matplotlib.pyplot as plt
data_dir = Path("data/white_weathering_crust_2_2023-07-15_15-25-24/")
white_weathering_crust = SpecArray.from_folder(data_dir)
white_weathering_crust.capture
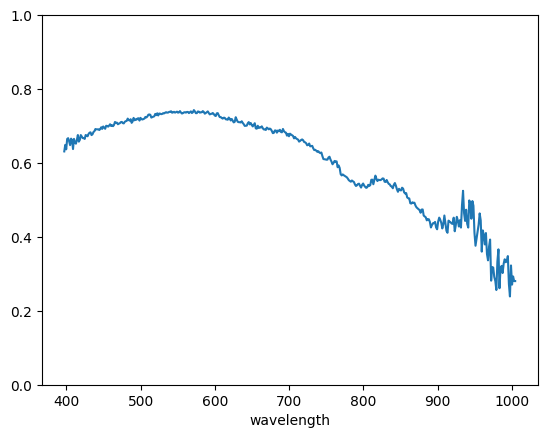
white_weathering_crust.spectral_albedo.sel(sample=0, point=0).plot.line()
plt.ylim(0, 1)The resulting imgage should look like this:
For more examples see the notebooks folder.