Home
A library for rendering 2D charts from Haskell.
A variety of plot types are supported, including line, point, error bars and area fills. Drawing traditional bar charts and pie charts is also straightforward. By default, axis scaling and labelling is fully automatic, though can be manually overridden. Logarithmic axes are also supported.
Layouts can be stacked to display multiple charts in a single image.
New plot types can be easily defined, either directly in user code, or contributed as additions to the library.
A layout is parametrised in the API by the types of its axes. Numeric
types are supported, of course, but also DateTime and indexed
values. Lenses are used to simplify access to the data model.
Thanks to a successful Google Summer of Code project, rendering is now done through an abstracted backend API. Currently supported are Cairo and Diagrams, though implementing additional backends is straightforward. The cairo backend can render to PNG, PS, SVG and PDF files, as well as directly to GTK windows. The diagrams backend can render to SVG and PS files.
Although the library doesn't support interactivity directly, it produces "pick functions" which map from device coordinates back to model coordinates and chart elements. These functions can be used to create simple interactivity.
Click on the example below to enlarge and view its Haskell source.
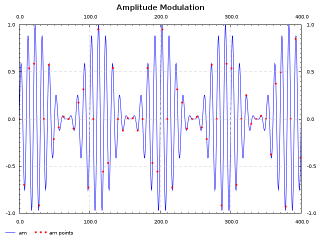


Example 11
Complete working project of this example: https://github.com/chrissound/HaskellChartBarGraphExample


There are some basic instructions on getting up and running using the stack tool.
The haddock API documentation is available from Hackage:
A FAQ is under construction, and there is a page on configuring and using the various backend combinations.
The stable version of the library is available from Hackage. To install the core library and the diagrams backend:
cabal update
cabal install chart-diagrams
For the cairo backend, it is recommended to install and test gtk2hs first. There are instructions on the Haskell wiki. Once that is done, installation of the chart library and cairo backend is also straightforward:
cabal update
cabal install chart-cairo
The development version of the library is available via git from the GitHub repository.
Thanks to following for contributing patches:
- David Roundy
- Francisco Jerez
- Russell O'Connor
- Eugene Kirpichov
- Malcolm Wallace
- Bradford Larsen
- John Lato
- Khudyakov Alexey
- Dimitris Karangelos
- Jan Bracker
- Ben Gamari
- Douglas Burke
- Anton Vorontsov
The Mailing List sees little traffic now. Most communications happens via the GitHub issue tracker. Feel free to use either.
Pull requests welcome!