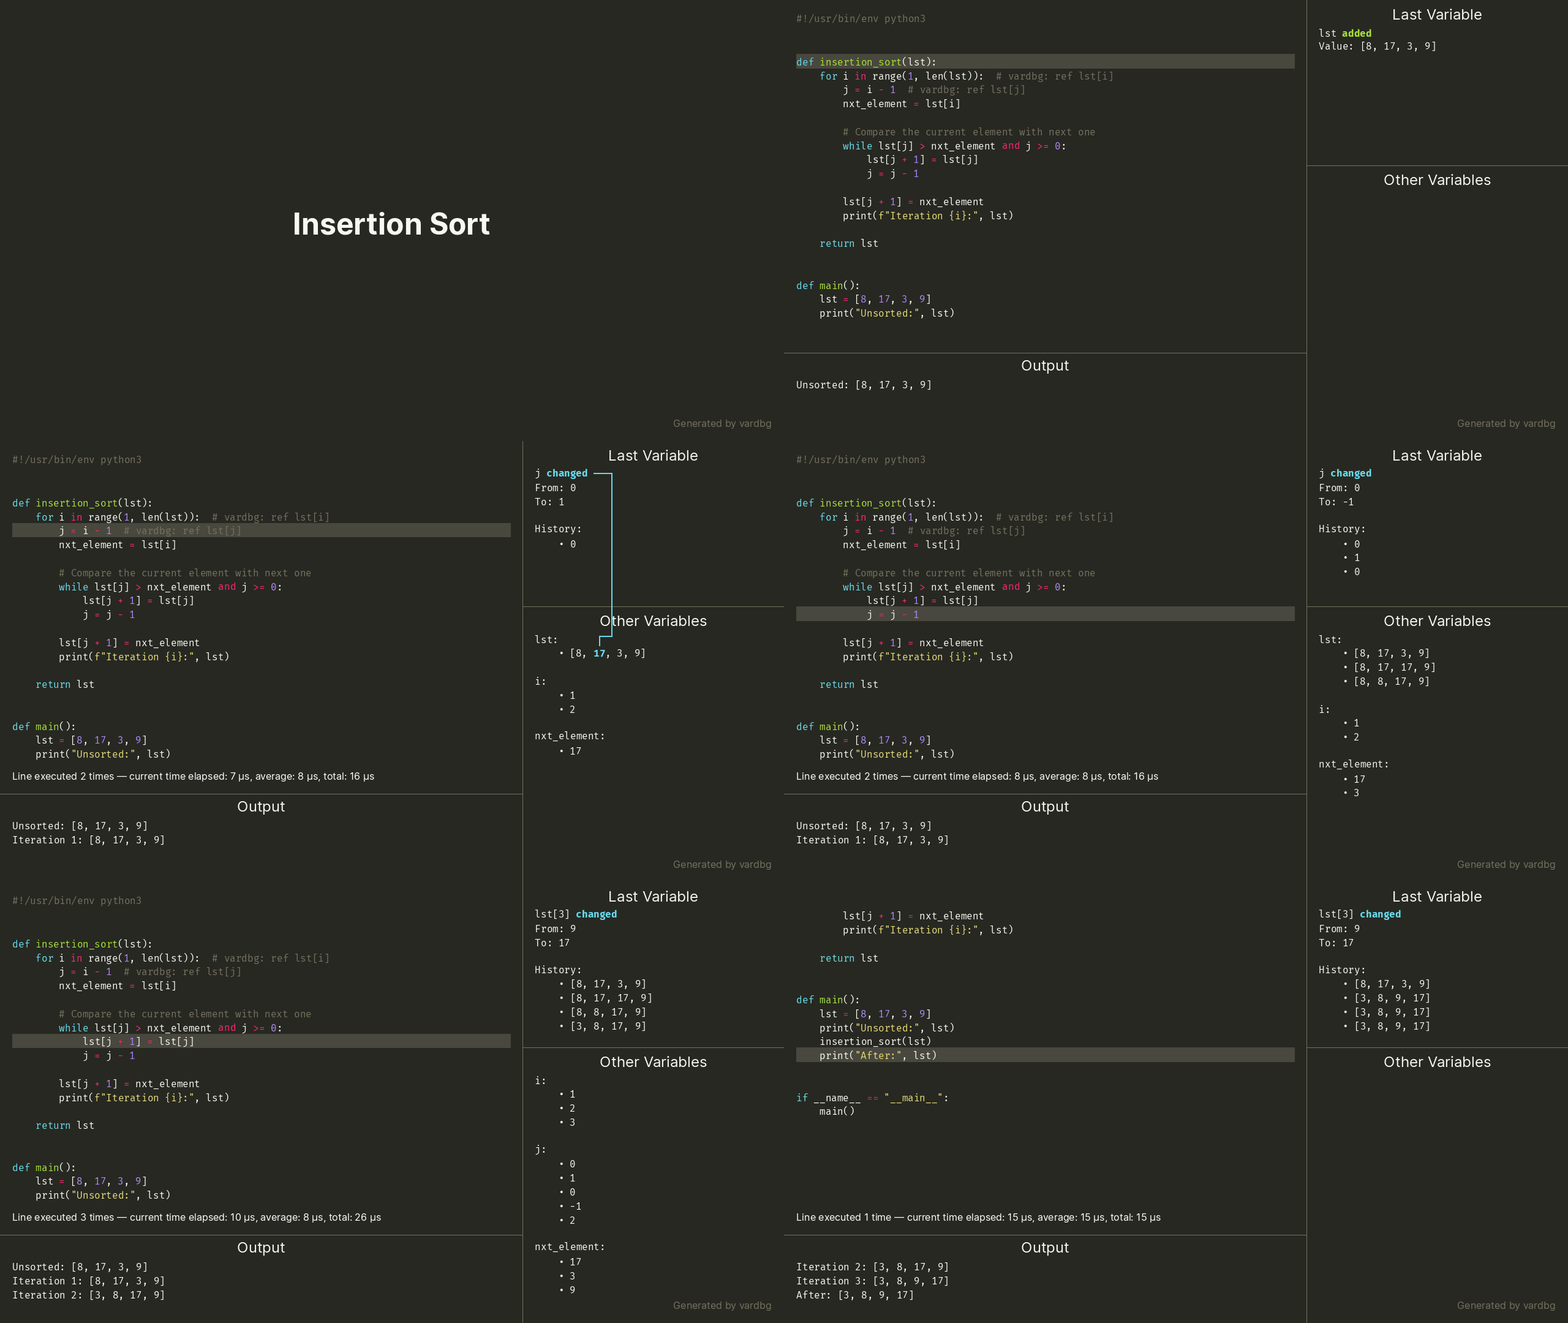
A simple Python debugger and profiler that generates animated visualizations of program flow. It is meant to help with learning algorithms by allowing you to visualize what the algorithms are doing.
Python 3.6 or newer is required due to the use of f-strings.
This project was created during Google Code-in 2019 for CCExtractor Development.
- Tracking the history of each variable and its contents
- Tracking elements within containers (lists, sets, dicts, etc.)
- Ignoring specific variables
- Profiling the execution of each line
- Summarizing all variables and execution times after execution
- Passing arguments to debugged programs
- Exporting execution history in JSON format and replaying (including program output)
- Creating videos that show program flow, execution times, variables (with relationships), and output
- Writing videos in MP4, GIF, and WebP formats
The latest tagged version can be obtained from PyPI:
pip install vardbgAlternatively, one can clone this repository and run it directly after installing dependencies:
git clone https://github.com/CCExtractor/vardbg
cd vardbg
python3 -m venv venv
source venv/bin/activate
pip install poetry
poetry install .
./debug.py
It can also be installed from the repository:
pip install .The above instructions assume the use of a virtual environment to avoid interfering with the system install of Python.
All of the debugger's subcommands and options are documented in the usage help, which is readily available on the command line.
For example, this command will debug the function quick_sort from the file sort.py with the arguments 9 3 5 1 and record the session to a JSON file named sort1.json:
vardbg run sort.py quick_sort -o qsort.json -a 9 -a 3 -a 5 -a 1A video can then be generated from the above recording:
vardbg replay qsort.json -v sort_vis.mp4It is possible to generate videos live while running the debugged program, but this is discouraged because the overhead of video creation inflates execution times greatly and thus ruins profiler results. However, if profiling is not important to you, it is a valid use case.
The video generator has many options: resolution, speed, fonts, and sizes. These options can be modified using a TOML config file. The default config documents the available options, which can be customized in an minimal overlay config without having to duplicate the entire config. The config can then be used by passing the -c argument on the command line.
An example of a simple overlay is the config used to generate official demo videos for embedding in READMEs. This simple config increases the speed (FPS) slightly and adds an intro screen at the beginning of the video.
Special comments can be added to lines of code that define variables to control how vardbg handles said variable:
# vardbg: ignore— do not display this variable or track its values# vardbg: ref lst[i]— treat variableias the index/key of an element in containerlst(only shown in videos)
Specifying the name of the variable may appear to be redundant, but there are two reasons behind this: reliably parsing all code that defines variables is very hard (there are more possible methods than one might think — loops, unpacking, direct assignments, exec calls, etc.), and more than one variable can be declared on a line. For example, tuple unpacking and function arguments are common occurrences of multiple variables being added on a single line. Thus, specifying the variable name in references is mandatory to prevent ambiguity.
Feel free to contribute to this project! You can add features, fix bugs, or make any other improvements you see fit. We just ask that you follow the code style guidelines to keep the code consistent and coherent. These guidelines can easily be enforced before pushing with the pre-commit framework, which can install Git pre-commit hooks with the pre-commit install command.
Once your contribution meets the guidelines, open a pull request to make things official.

