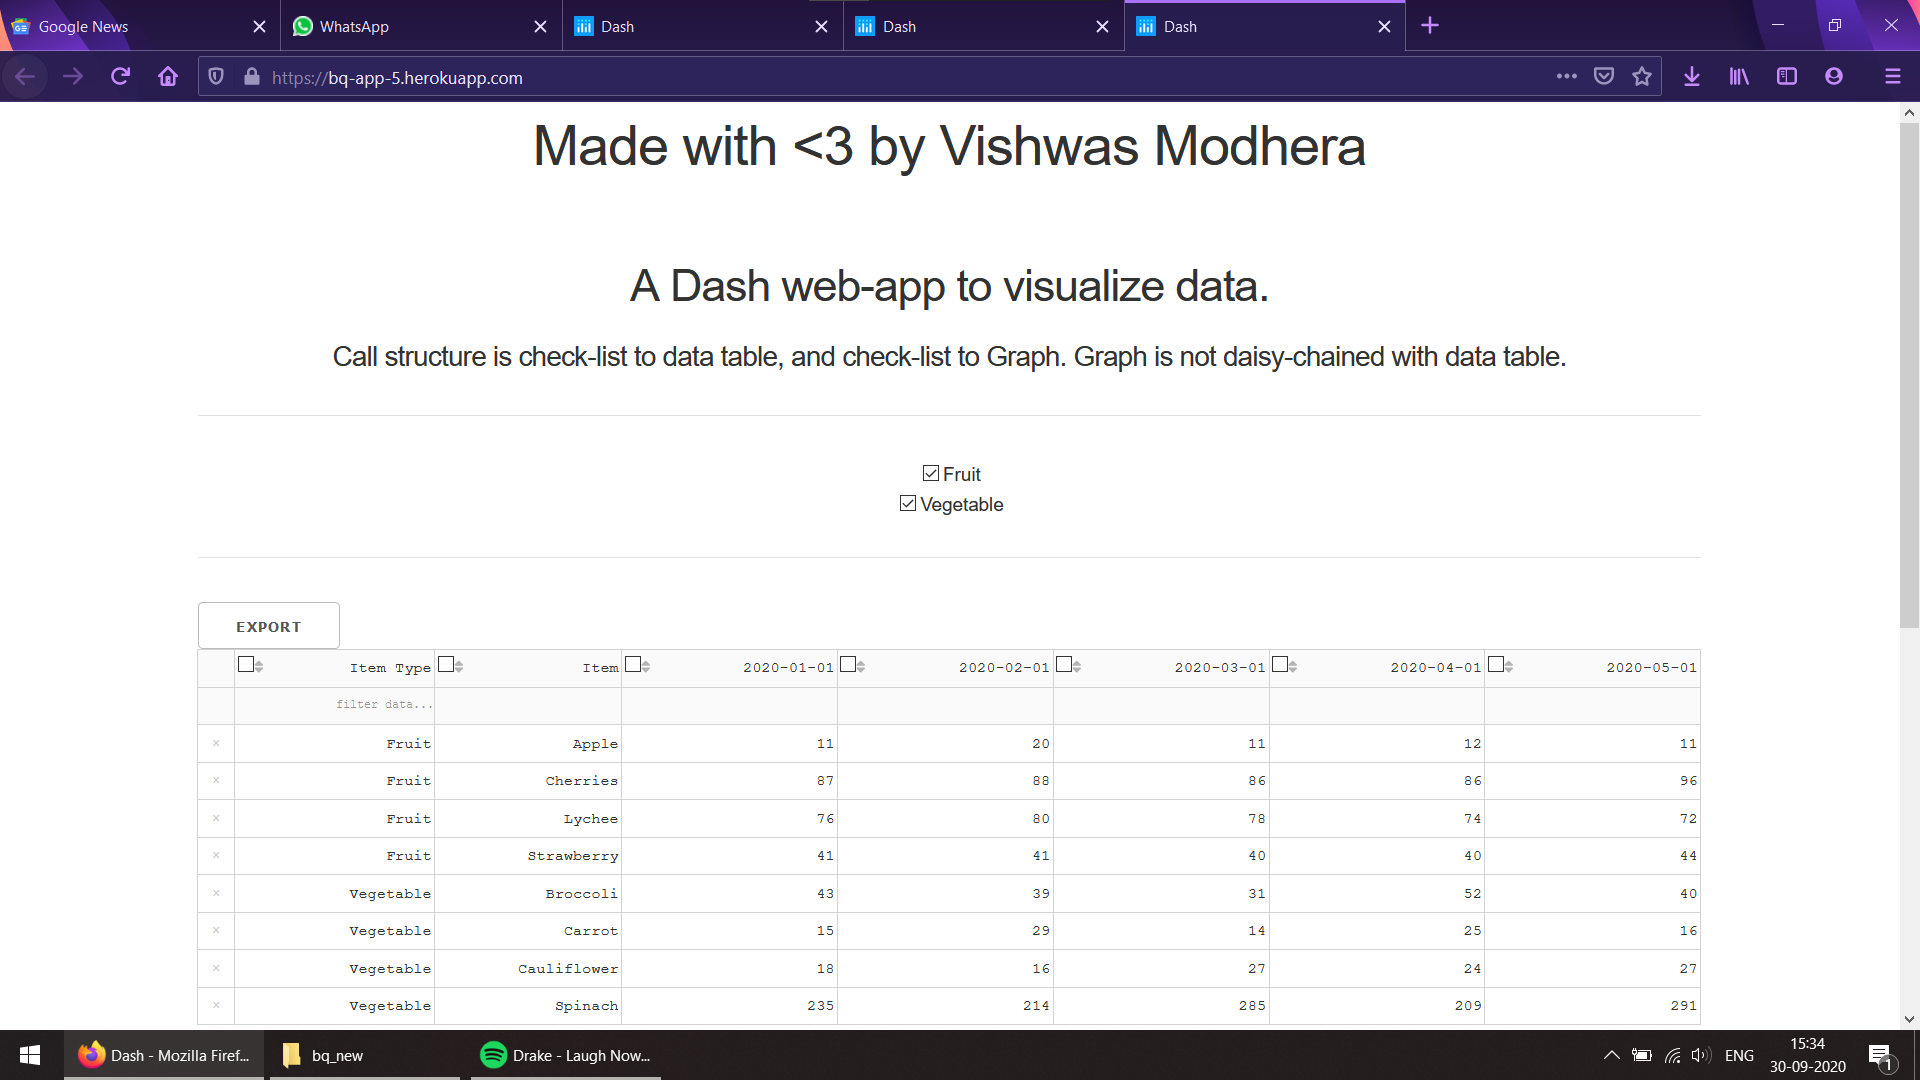
This is a basic dashboard which takes in data from a .csv (that has only 8 records) and then gives user the control to display whatever he wants based on the filters in the data table. Dash by Plotly has been used in this project. One also can export the data table in its current state and save it as a .xls file.
pip install -r requirements.txt
This requires the framework Dash and its libraries and dependencies. It also requires pandas for reading the .csv file. gunicorn is used to deploy the app on heroku.
Procfile contents : web:gunicorn app:server
App has been deployed on Heroku. Procfile has been uploaded with it. It has been deployed in United State servers (because it doesn't have servers in India) so the callbacks may take few hundred milliseconds.
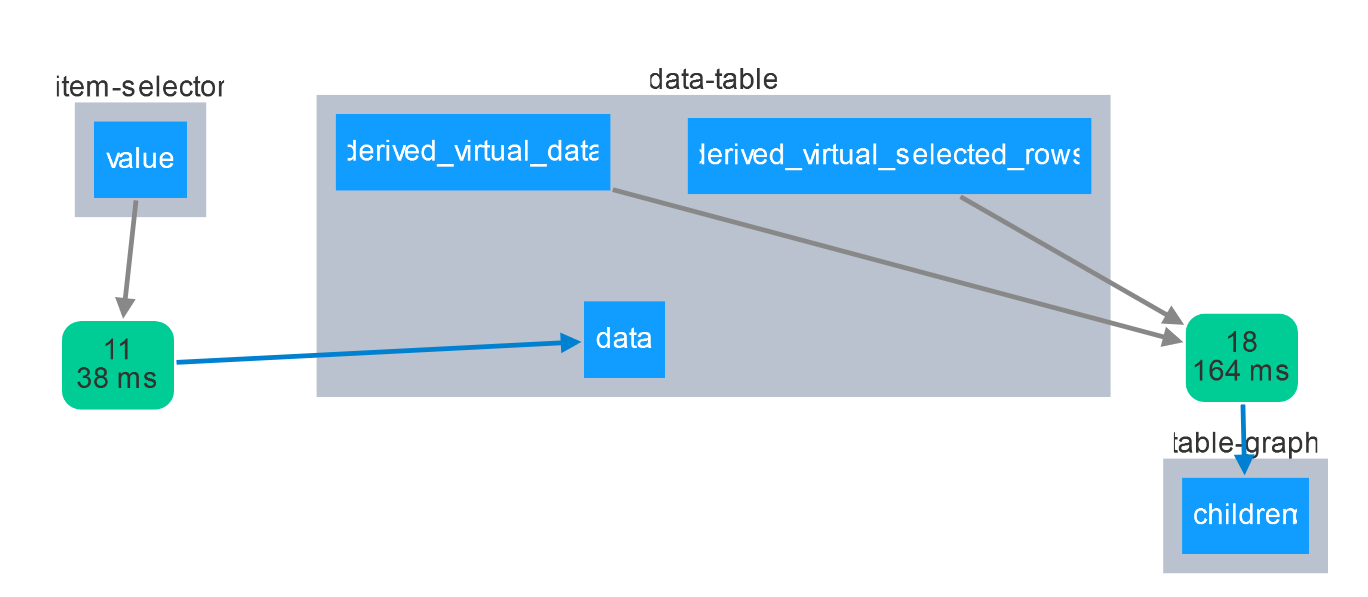
 Here, the item-selector is the id of checklist component. Whatever changes are made to that checklist, they are reflected in data-table (the Dash data table) and table-graph (the lineplot of the data table).
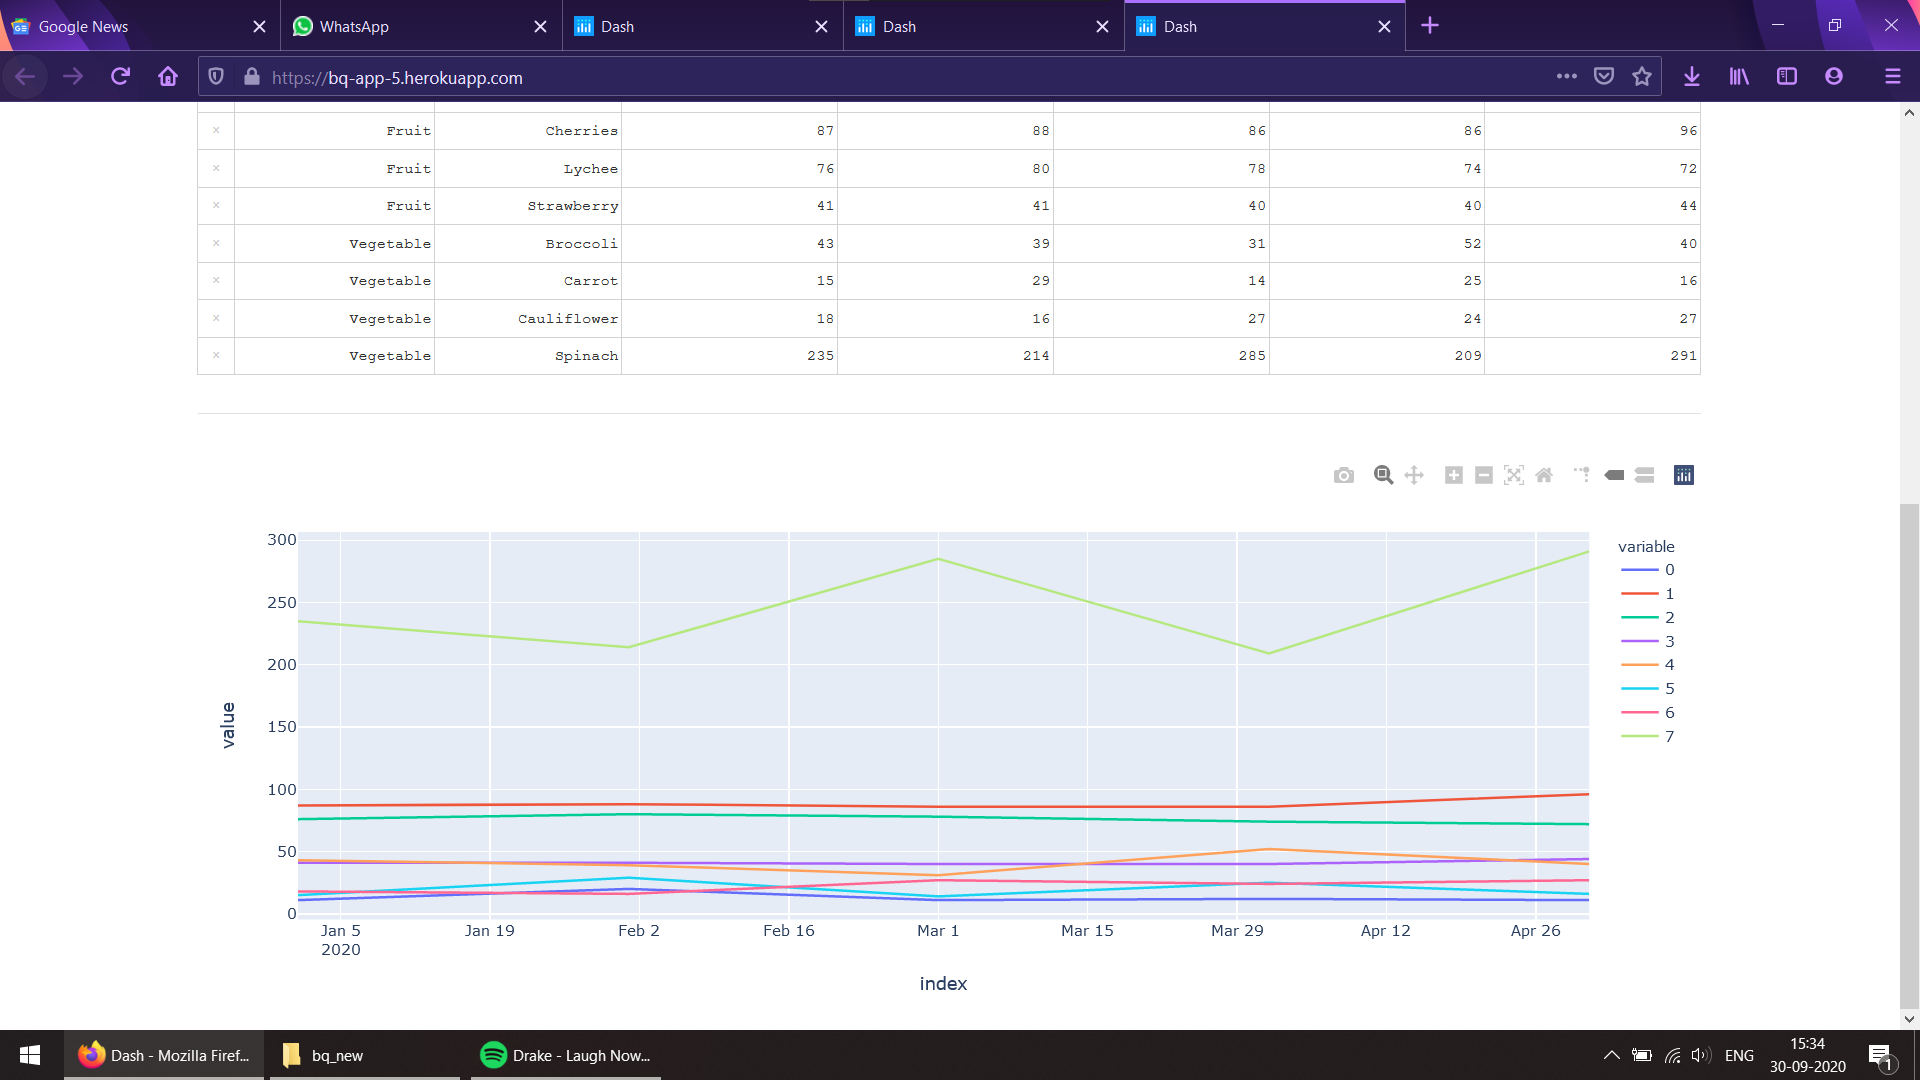
Whatever changes are made to the data table using either filters or the checklist, the changes are also reflected in the lineplot!
- Better UI.
- Adding a bootstrap theme.

