Tutorial: https://interactivereport.github.io/RNASequest/tutorial/docs/
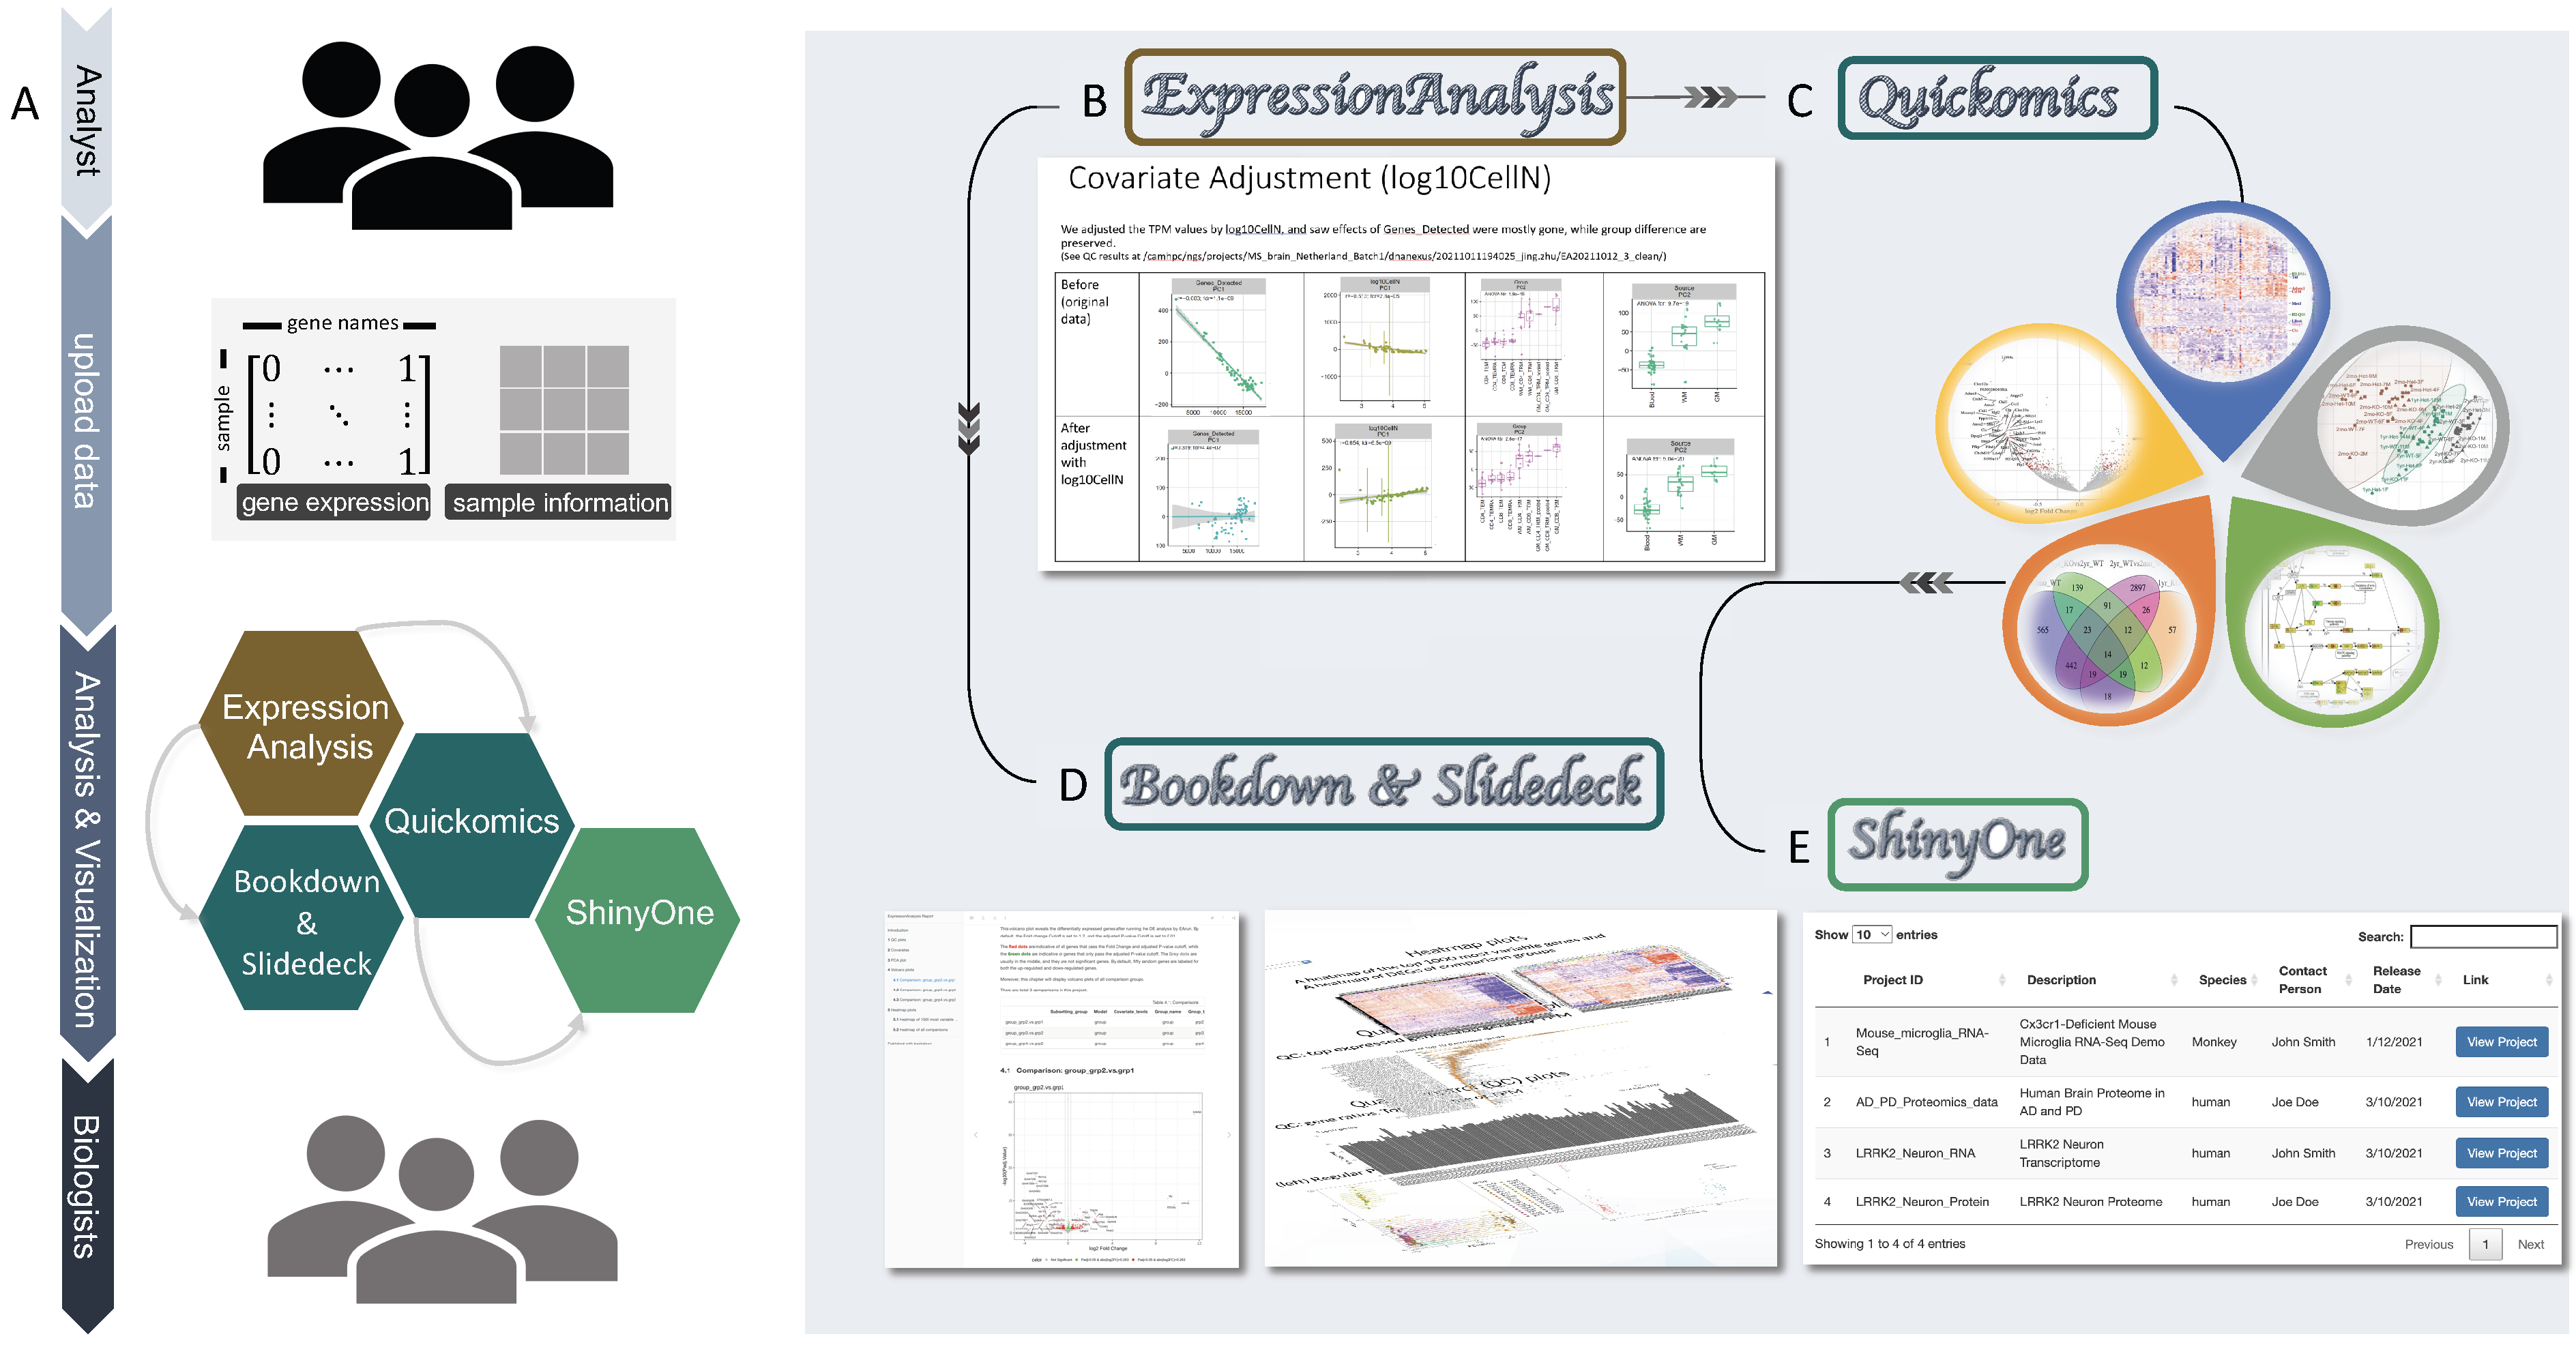
Fig. 1. Overview of the RNASequest workflow. (A) Analyst supplies gene expression matrix, sample information to the automated pipeline, ExpressionAnalysis, in abbreviation EA, to generate reports in Bookdown and interactive slide deck formats, and a data visualization app for Biologists with limited computational experience to investigate datasets by reviewing the reports and exploring the data interactively. (B) EA will check covariates and guide ana-lysts to build correct models for differential gene expression analysis. (C) R data objects outputted by EA will be uploaded to Quickomics R Shiny application for further exploration and visualization in PCA, Heatmap, Pathway, Volcano, Boxplot, and Venn Diagram. (D) EA publish module will automatically generate analysis reports in both Bookdown and interactive online slides format. (E) ShinyOne, an R Shiny app will manage the collection of datasets with Quickomics launching links and links to Bookdown documents and slide decks. It provides basic search and sorting functions for users to locate datasets of interest.
A pipeline to RNAseq data analysis
Five main functions are provided:
- EAinit: Generates a set of project analysis files based on the input files.
- EAqc: Analyzes the covariates against the expression to determine if the expression is needed to be adjusted.
- EArun: Performs differential expression analysis and produces QuickOmics objects for webserver loading.
- EAreport: Generates a bookdown report for visualization.
- EA2DA: Produces required data files for OmicsView project import.
First we install RNASequest by downloading the scripts from GitHub:
git clone https://github.com/interactivereport/RNASequest.git
cd RNASequest

# Install RNASequest conda environment
# Please make sure you have conda installed before, and this step may take a while
bash install

# The .env will be created under the src directory
ls ~/RNASequest/src/.env

# Check the path of current directory and add it to $PATH:
CurrentDir=`pwd`
export PATH="$CurrentDir:$PATH"

# However, the above command only adds the RNASequest directory to $PATH temporarily
# To add it to the environment permanently, edit ~/.bash_profile or ~/.bashrc:
vim ~/.bash_profile
# Add the full path of the RNASequest directory to $PATH, for example, $HOME/RNASequest
PATH=$PATH:$HOME/RNASequest
# Source the file
source ~/.bash_profile
EAinit A/path/to/a/DNAnexus/result/folder

# Example:
EAinit ~/RNASequest/example/SRP199678
Execution of the above command will create a sub-folder (EA[timestamp]) in the specified RNAseq result folder. There will be five files in the result folder:
- compareInfo.csv: an empty comparison definition file (with header). Please fill in this file before the
EAruncall. - config.yml: a config file specifies the parameters of the
EAqcandEArun. Please update covariates_adjust afterEAqc. - geneAnnotation.csv: a gene annotation file including gene symbol.
- sampleMeta.csv: a sample meta-information file, please feel free to add additional columns whose column names should be considered to be added into covariates_check in config.yml.
- alignQC.pdf: plots generated from alignment QC metrics.
Please pay attention to the std out messages.
EAqc A/path/to/a/config/file

#Example:
EAqc ~/RNASequest/example/SRP199678/EA20220328_0/config.yml
Through executing the command with the above default config file, expression PC analysis will be done against covariates specified in covariates_check in the config.yml file. An Excel file will list p-values for all numeric and categorical covariates, and significant ones will be in plot pdf files. The analysis before covariate adjusting will have the prefix covariatePCanalysis_noAdjust.
Based on the above results, you can add covariates into covariates_adjust in the config.yml file, and rerun EAqc. This time additional expression PC analysis will be applied to covariate-adjusted expression with files started with covariatePCanalysis_Adjusted.
Please pay attention to the std out messages.
EArun A/path/to/a/config/file

# Example:
EArun ~/RNASequest/example/SRP199678/EA20220328_0/config.yml
Please fill the compareInfo.csv before executing the above command.
Execution of the above command will produce R objects for QuickOmics webserver to load. The process will generate the covariate-adjusted logTPM for visualization; complete differentially expressed gene analysis and gene network generation.
The results (four files) can be uploaded to the QuickOmics webserver.
Please pay attention to the std out messages.
EAreport Path/to/a/config/file

# Example:
EAreport ~/RNASequest/example/SRP199678/EA20220328_0/config.yml
By running the command above, the pipeline will generate a BookdownReport folder in the same directory as the config file. This folder contains the raw Rmd files, as well as the final bookdown report, which is the BookdownReport/docs/index.html file. If you would like to send the full report to your collaborators, please download the tarball created under the EA working directory, named as ProjectName_BookdownReport.tar.gz (ProjectName was extracted from the config.yml file). The index.html inside it is the bookdown report.
EA2DA A/path/to/a/config/file

# Example:
EA2DA ~/RNASequest/example/SRP199678/EA20220328_0/config.yml
Execution of the above command will produce 6 data files which are required for the OmicsView project import.
Please fill the empty entries in the Project_Info.csv before import.
There are two config files in the pipeline folder:
- config.tmp.yml: The template of the config file, with all default values;
- sys.yml: the system config file, which includes:
- genome_path: the root path where the genome definition files (gtf) are located
- notCovariates: the column names from the sample meta information should not be considered as default covariates
- qc2meta: the column names from the mapping QC file should be extracted and inserted into the sample meta table
- QuickOmics_path: the file path to store the files for the QuickOmics web server display
- DA_columns: the column names available for the sample meta table in the OmicsView system
GitHub: https://github.com/interactivereport/Quickomics
Tutorial: https://interactivereport.github.io/Quickomics/tutorial/docs/
https://interactivereport.github.io/RNASequest/tutorial/docs/bookdown-component.html
https://interactivereport.github.io/RNASequest/tutorial/docs/slide-deck-component.html
https://interactivereport.github.io/RNASequest/tutorial/docs/shinyone-component.html
