-
Notifications
You must be signed in to change notification settings - Fork 6
Maximum rate
- Max TPS
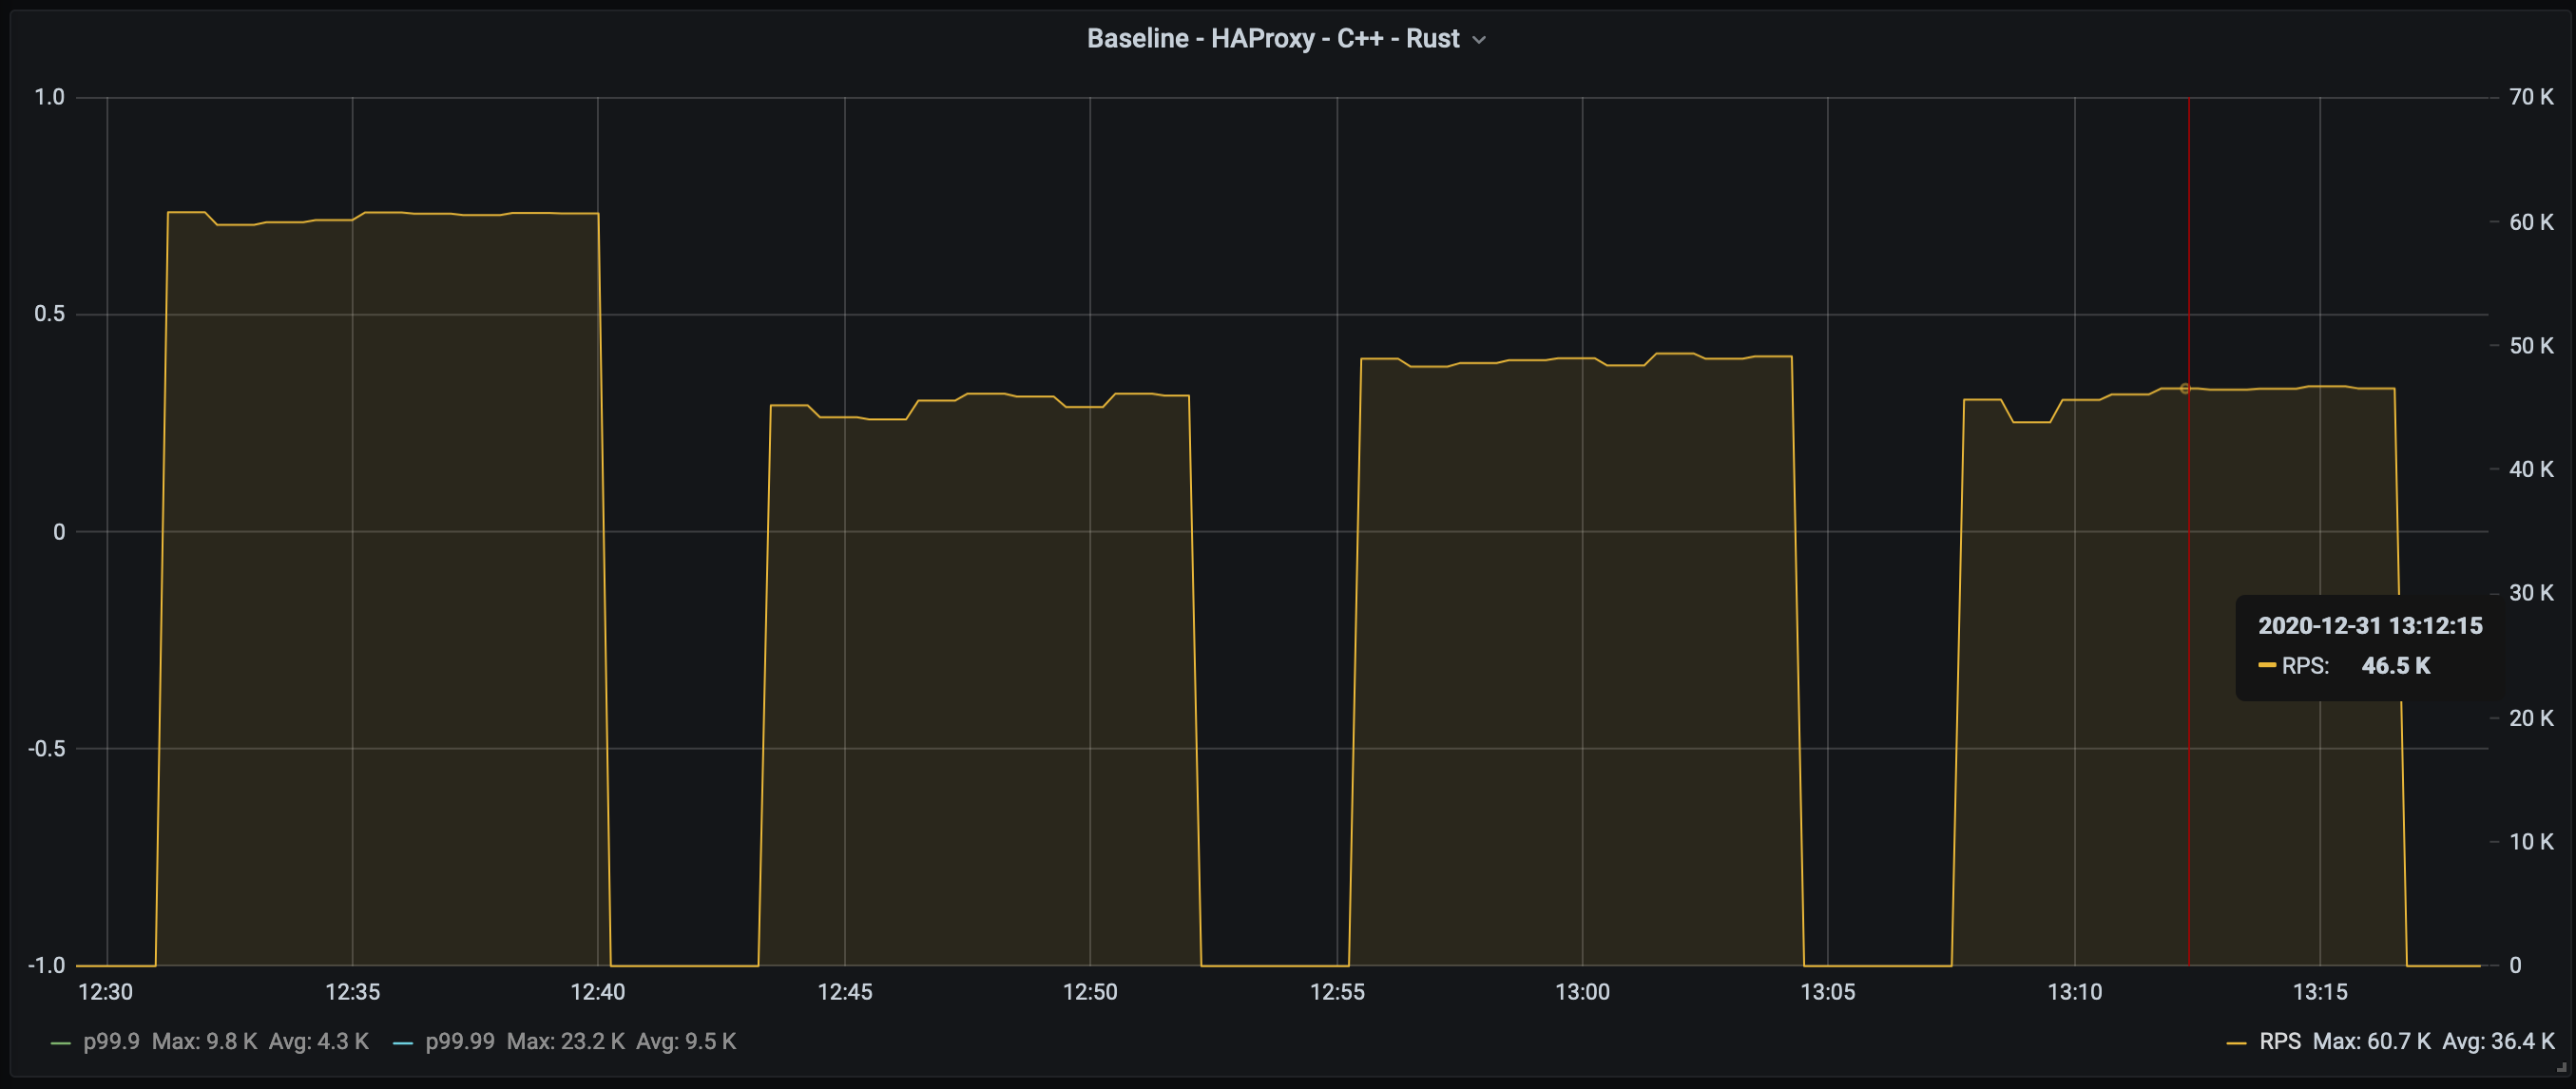
The load is generated without any rate-limiting with the concurrency setting 100.
The most interesting question is how much RPS each solution can handle?
While Nginx is capable of handling ~60k requests per second (impressive for just two cores!),
all three C/C++/Rust are somewhat comparable (but C++ handled slightly more requests):
- C - 45k
- C++ - 48.8k
- Rust - 46k
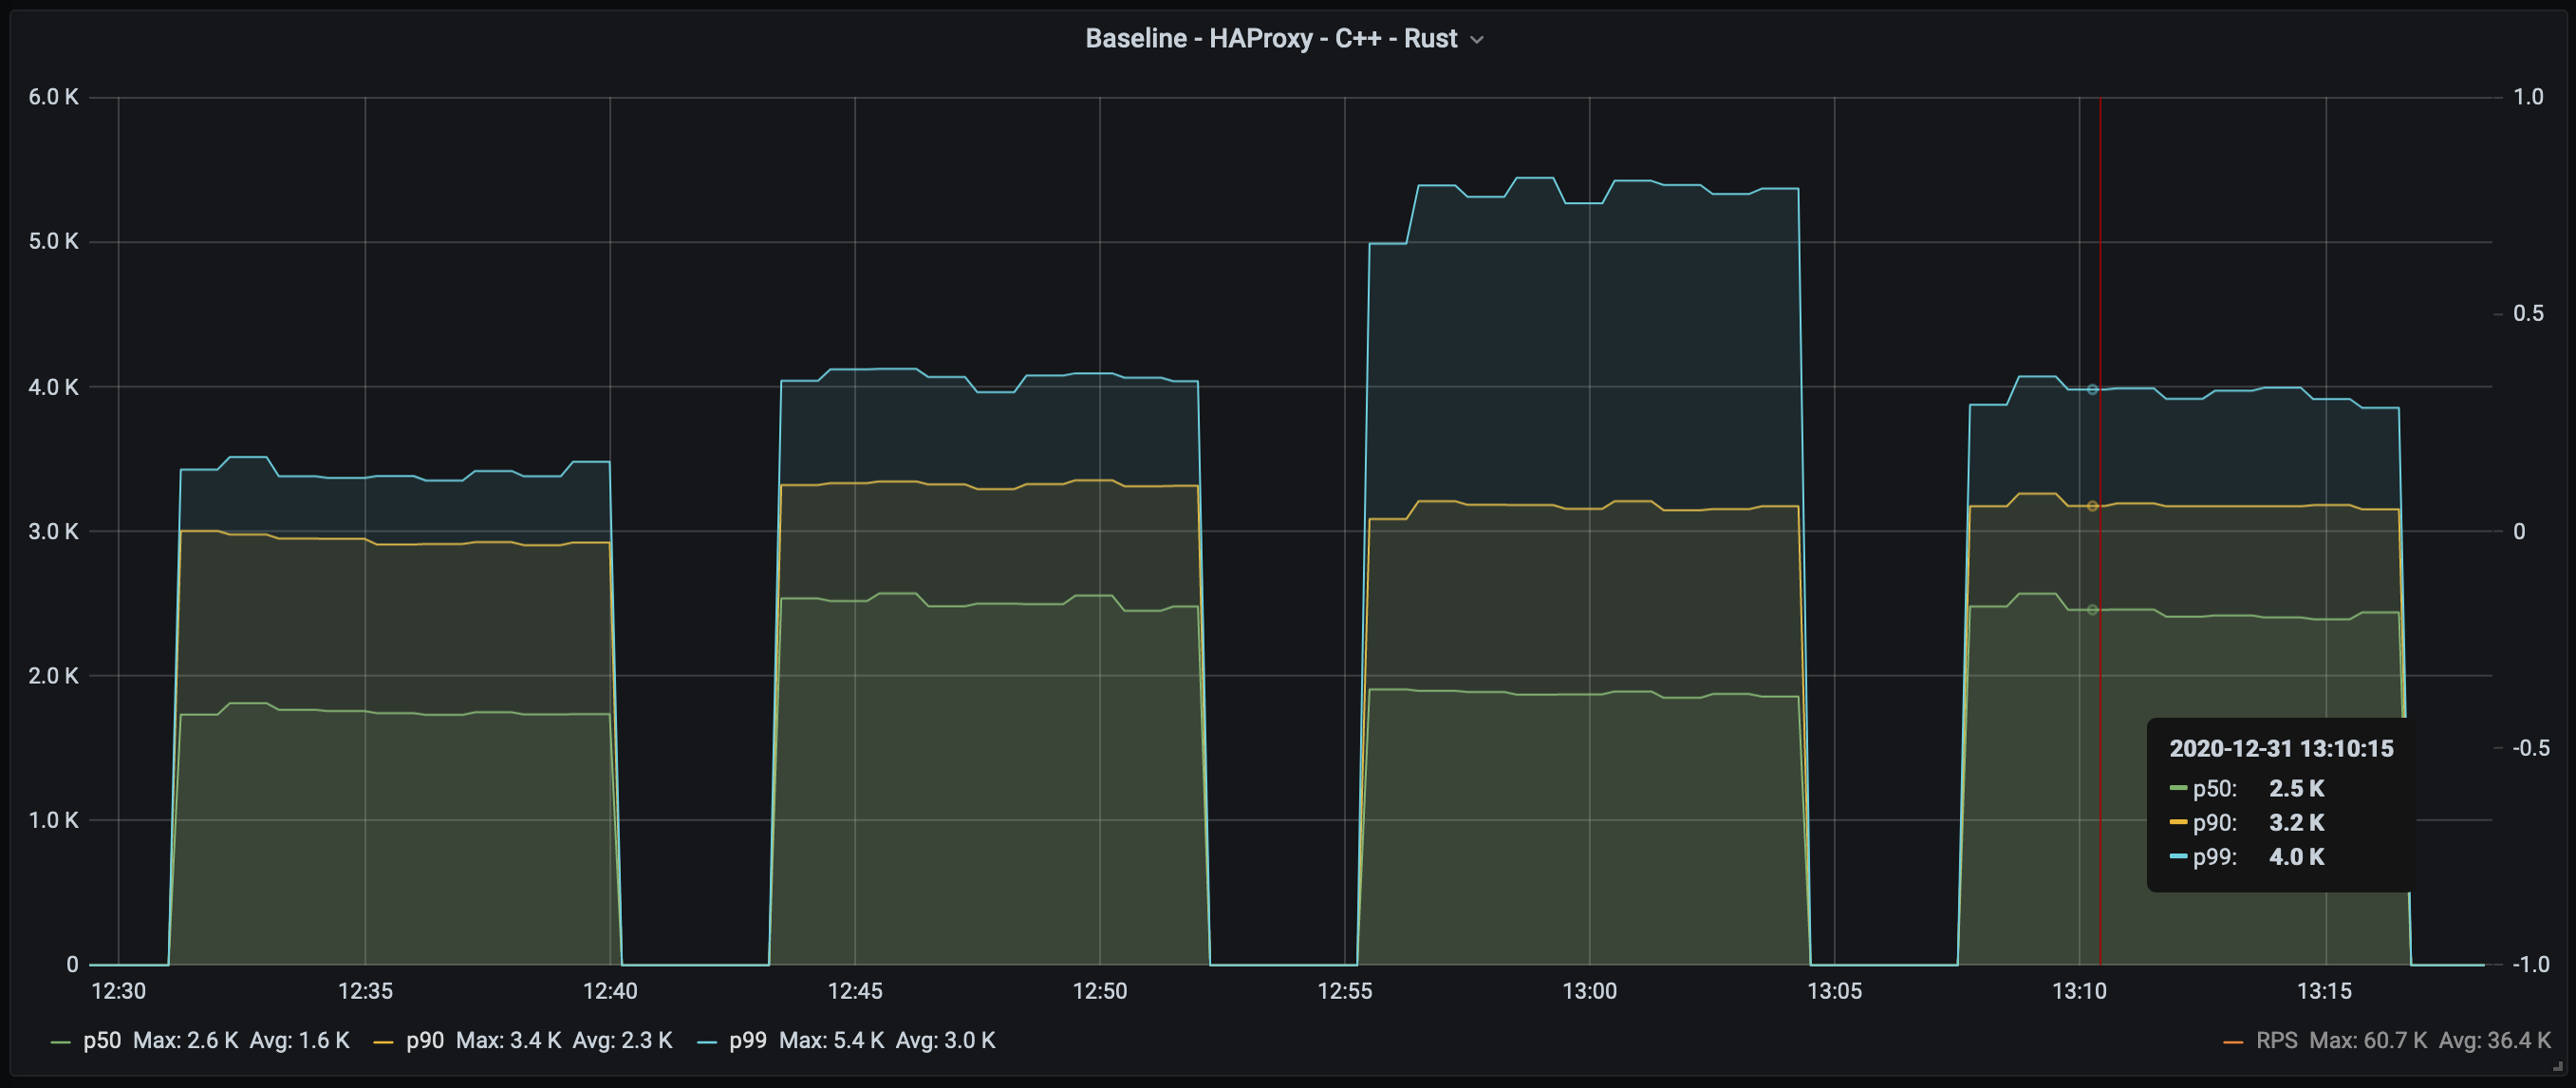
The results are somewhat mixed again. While C++ showed better p50, it's p99 is worse.
At the p90 level, all three are close:
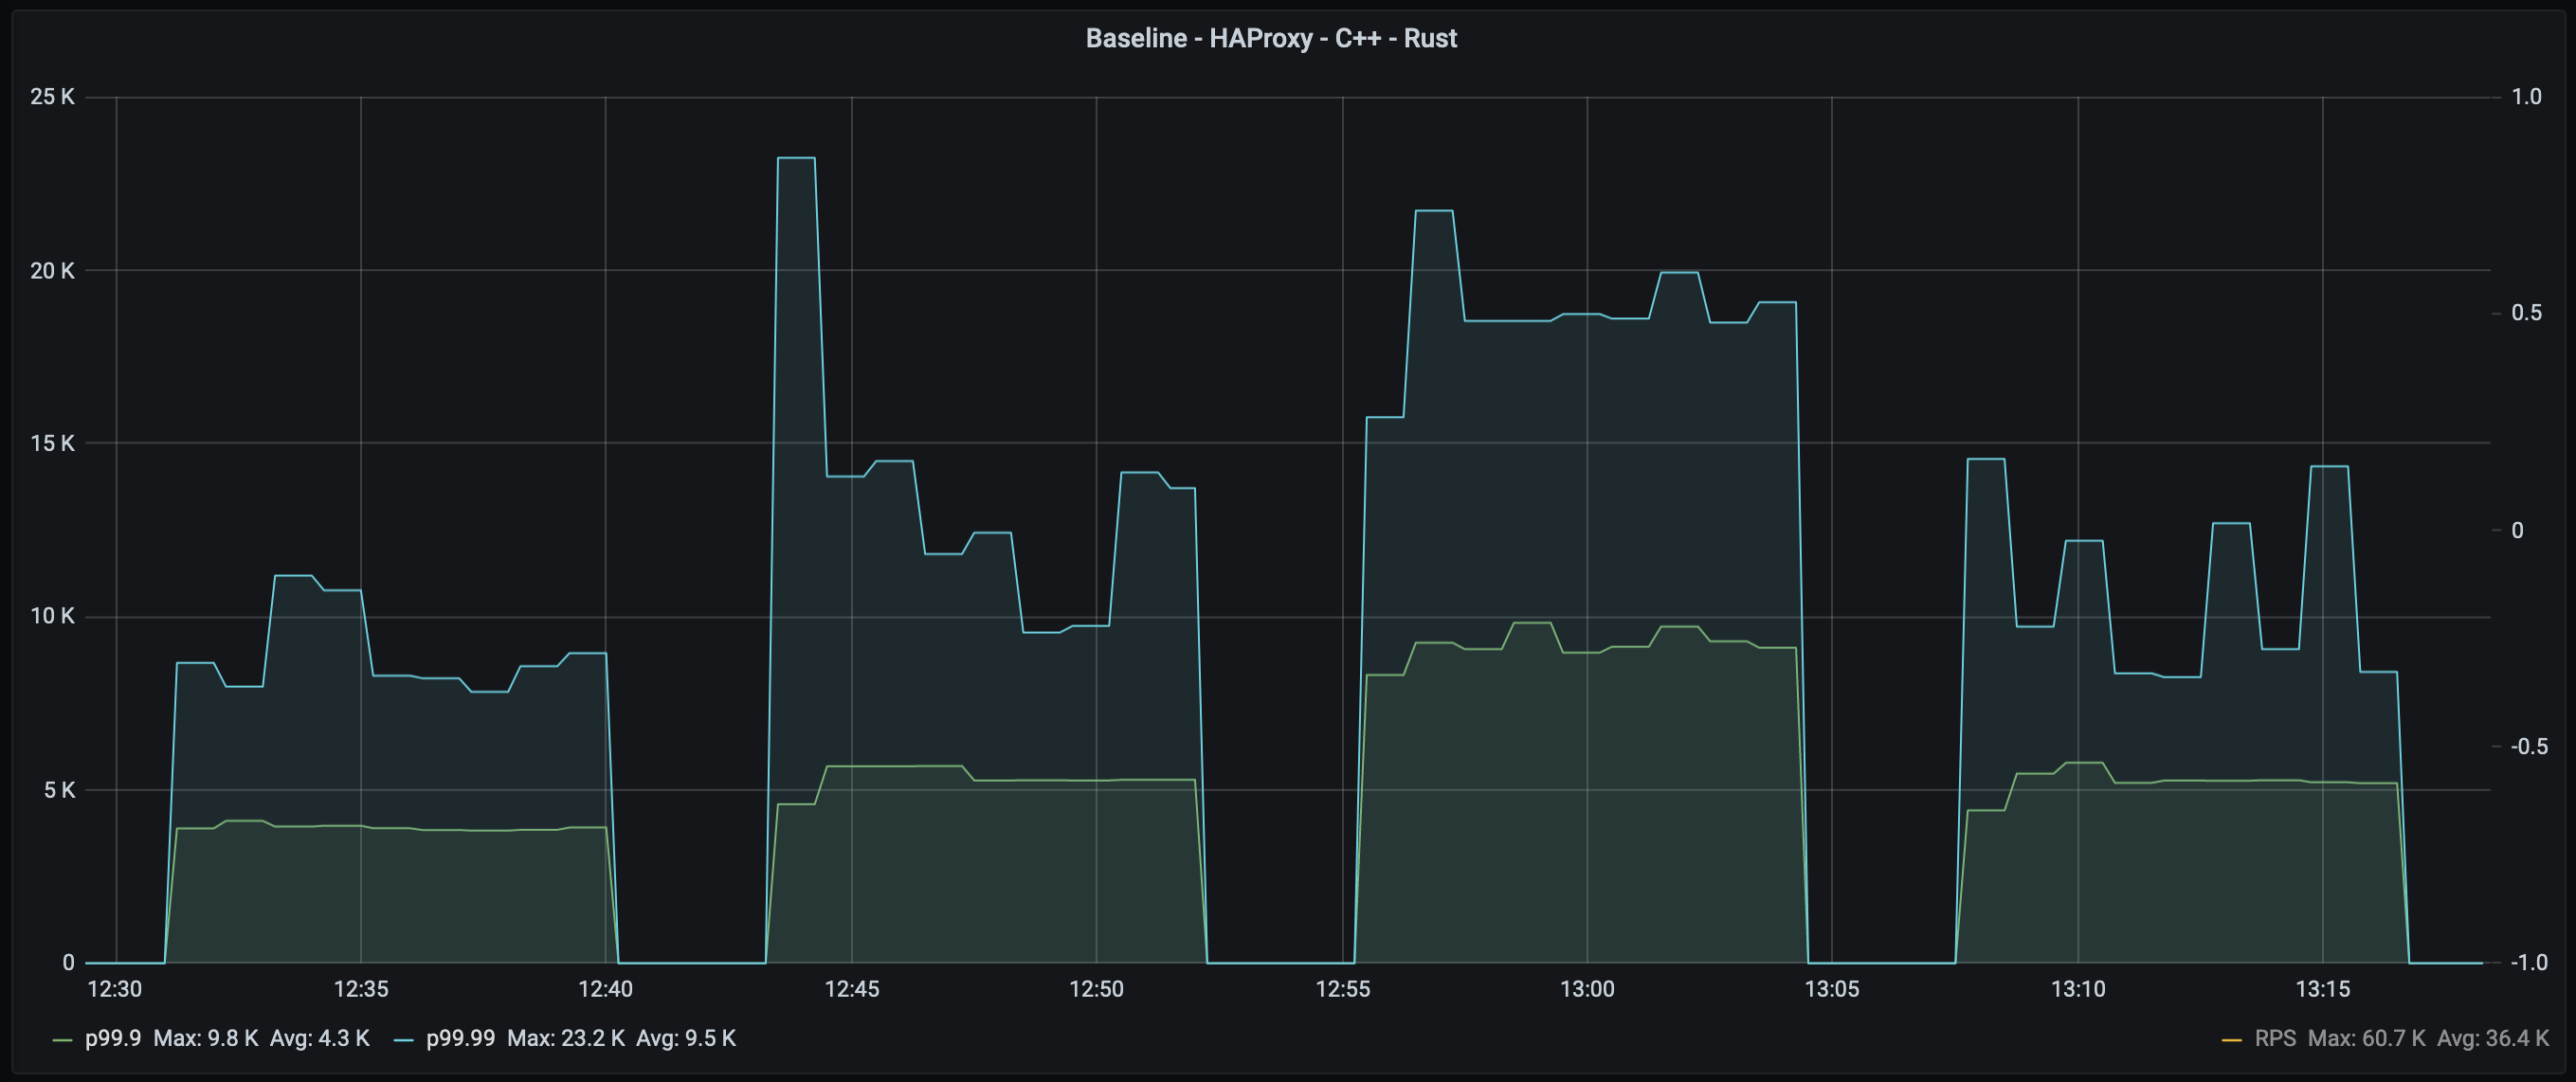
For the outlier latency, Rust is better than both C and C++:
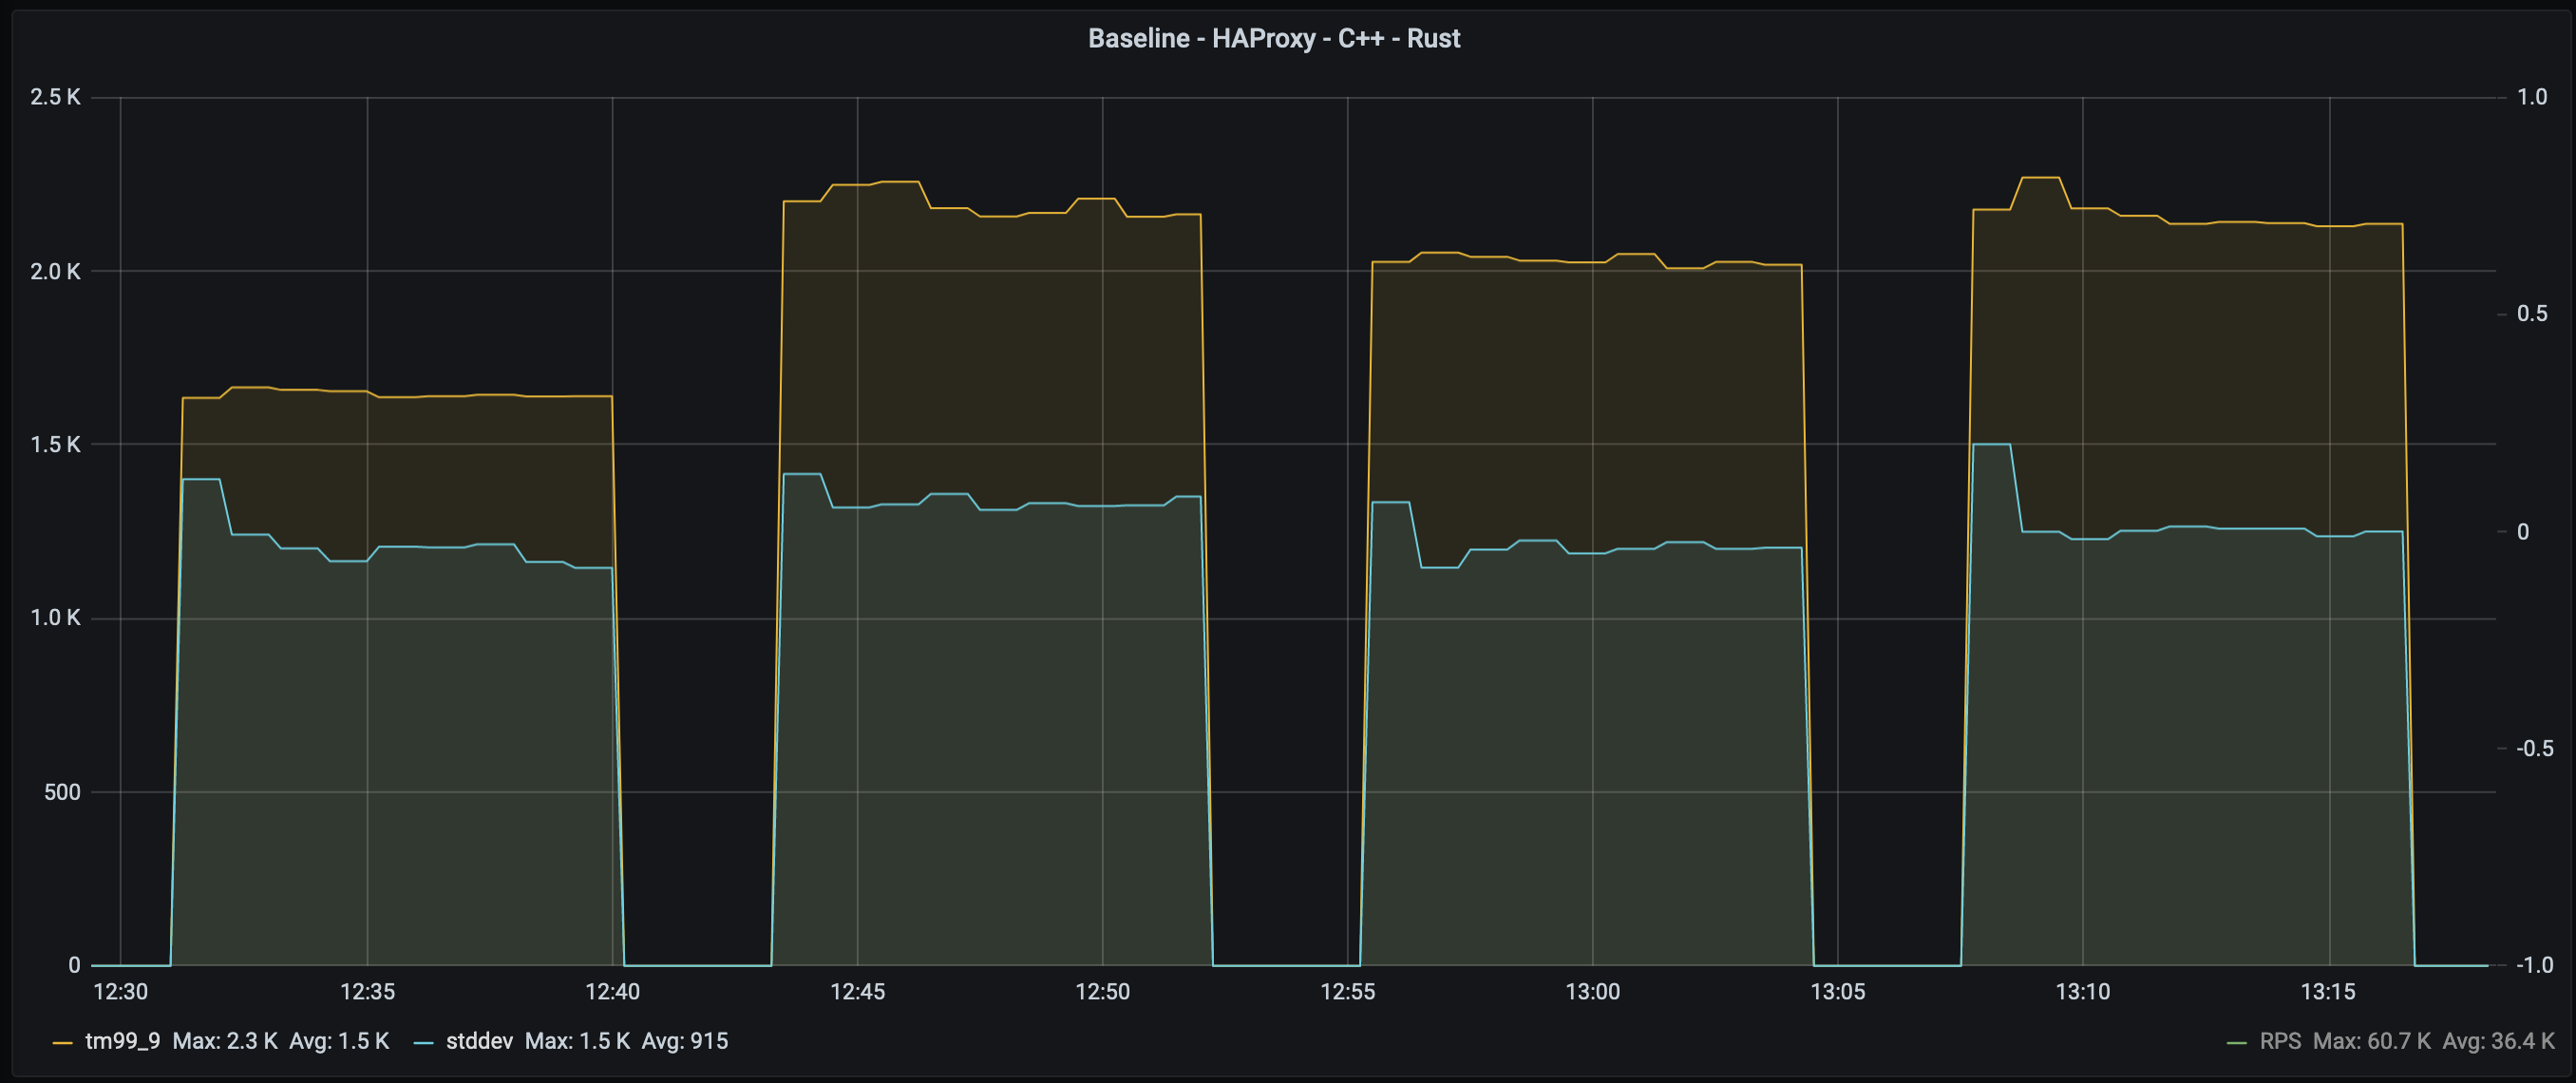
All three are nearly identical. However, C++ is a tiny bit better (see the table below for the numbers):
CPU utilization is important here. What we want is to saturate the CPU as much as we can.
Baseline CPU Utilization is 73%, but in fact, it is 93% of available cores (as cores 2 and 3 were not used).
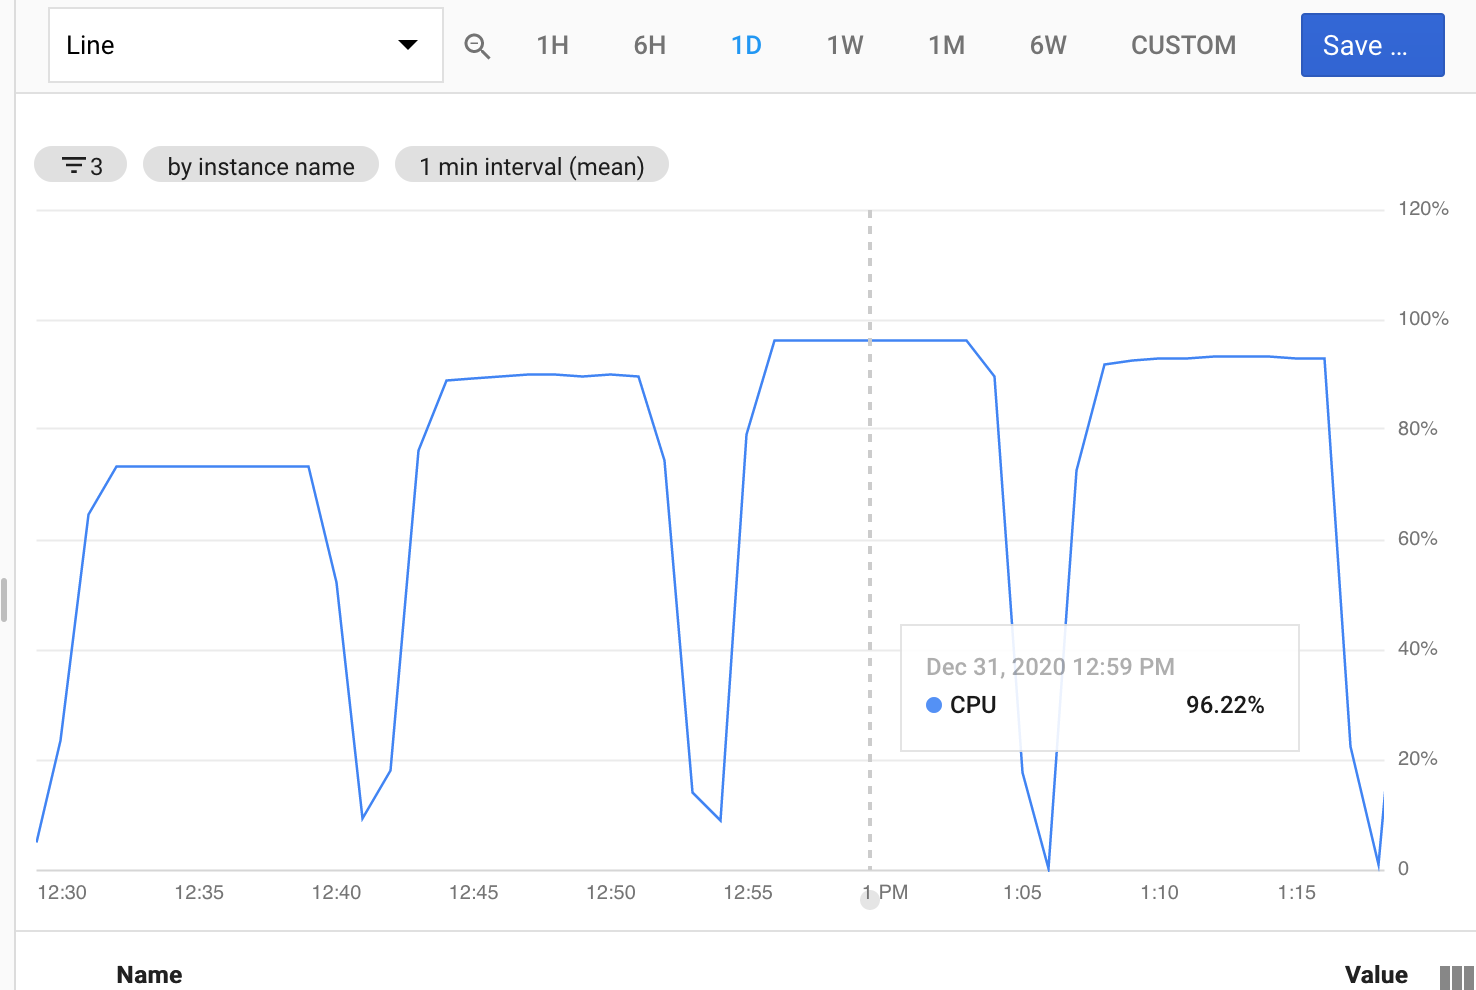
| CPU Utilization | |
|---|---|
| Baseline | 97% |
| C | 90% |
| C++ | 96% |
| Rust | 93% |
This means that C++ managed to use more CPU and spent more time handling requests.
However, it's worth mentioning that the draft-http-tunnel is implemented using callbacks, while the Rust solution is based on tokio,
which is a feature-rich framework and is much more flexible and extendable.
| p50 | p90 | p99 | p99.9 | p99.99 | max | tm99.9 | stddev | rps (k) | |
|---|---|---|---|---|---|---|---|---|---|
| Baseline | 1.8 | 2.9 | 3.4 | 3.9 | 9.0 | 202.6 | 1.6 | 1.2 | 60.4 |
| C (HAProxy) | 2.5 | 3.3 | 4.1 | 5.4 | 13.4 | 191.2 | 2.2 | 1.3 | 45.3 |
| C++ (draft-http-tunnel) | 1.9 | 3.2 | 5.3 | 9.2 | 18.9 | 205.4 | 2.0 | 1.2 | 48.8 |
| Rust (http-tunnel) | 2.4 | 3.2 | 3.9 | 5.2 | 10.8 | 202.5 | 2.2 | 1.3 | 46 |
Among memory safe, both Rust and Golang showed comparable throughput, while Java and Python were significantly behind:
- Rust - 46k
- Golang - 42.6k
- Java - 25.9k
- Python - 18.3k
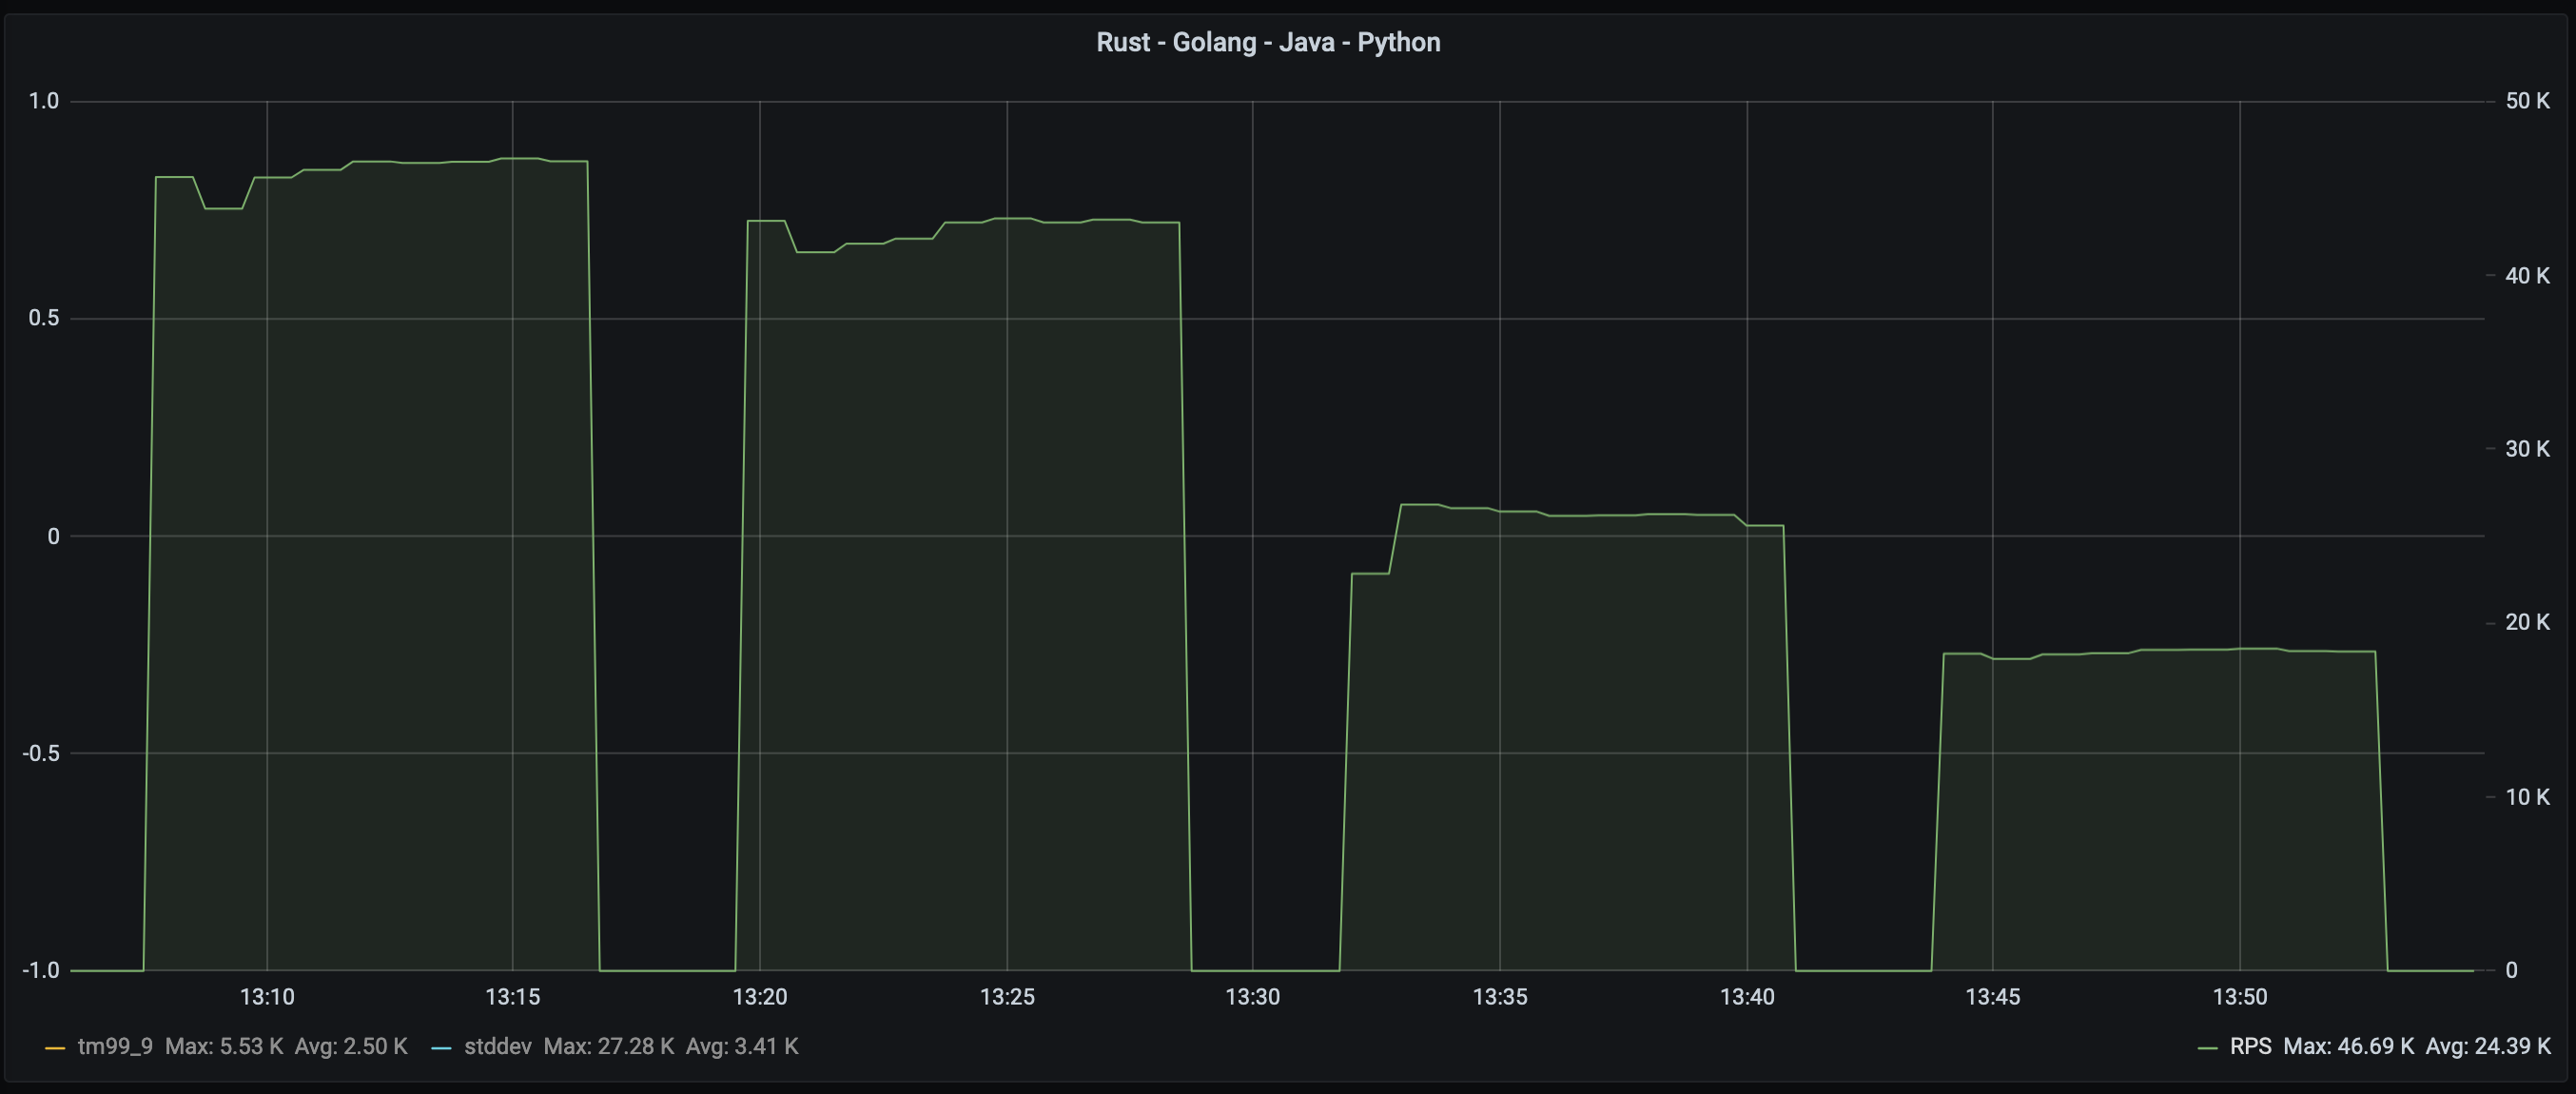
Again, we can see that at p50-p90 level, Golang is somewhat comparable to Rust,
but quickly deviates at p99 level, adding almost two milliseconds.
Java and Python exhibit substantially higher latencies, but Java p99 latency is much worse than Python:
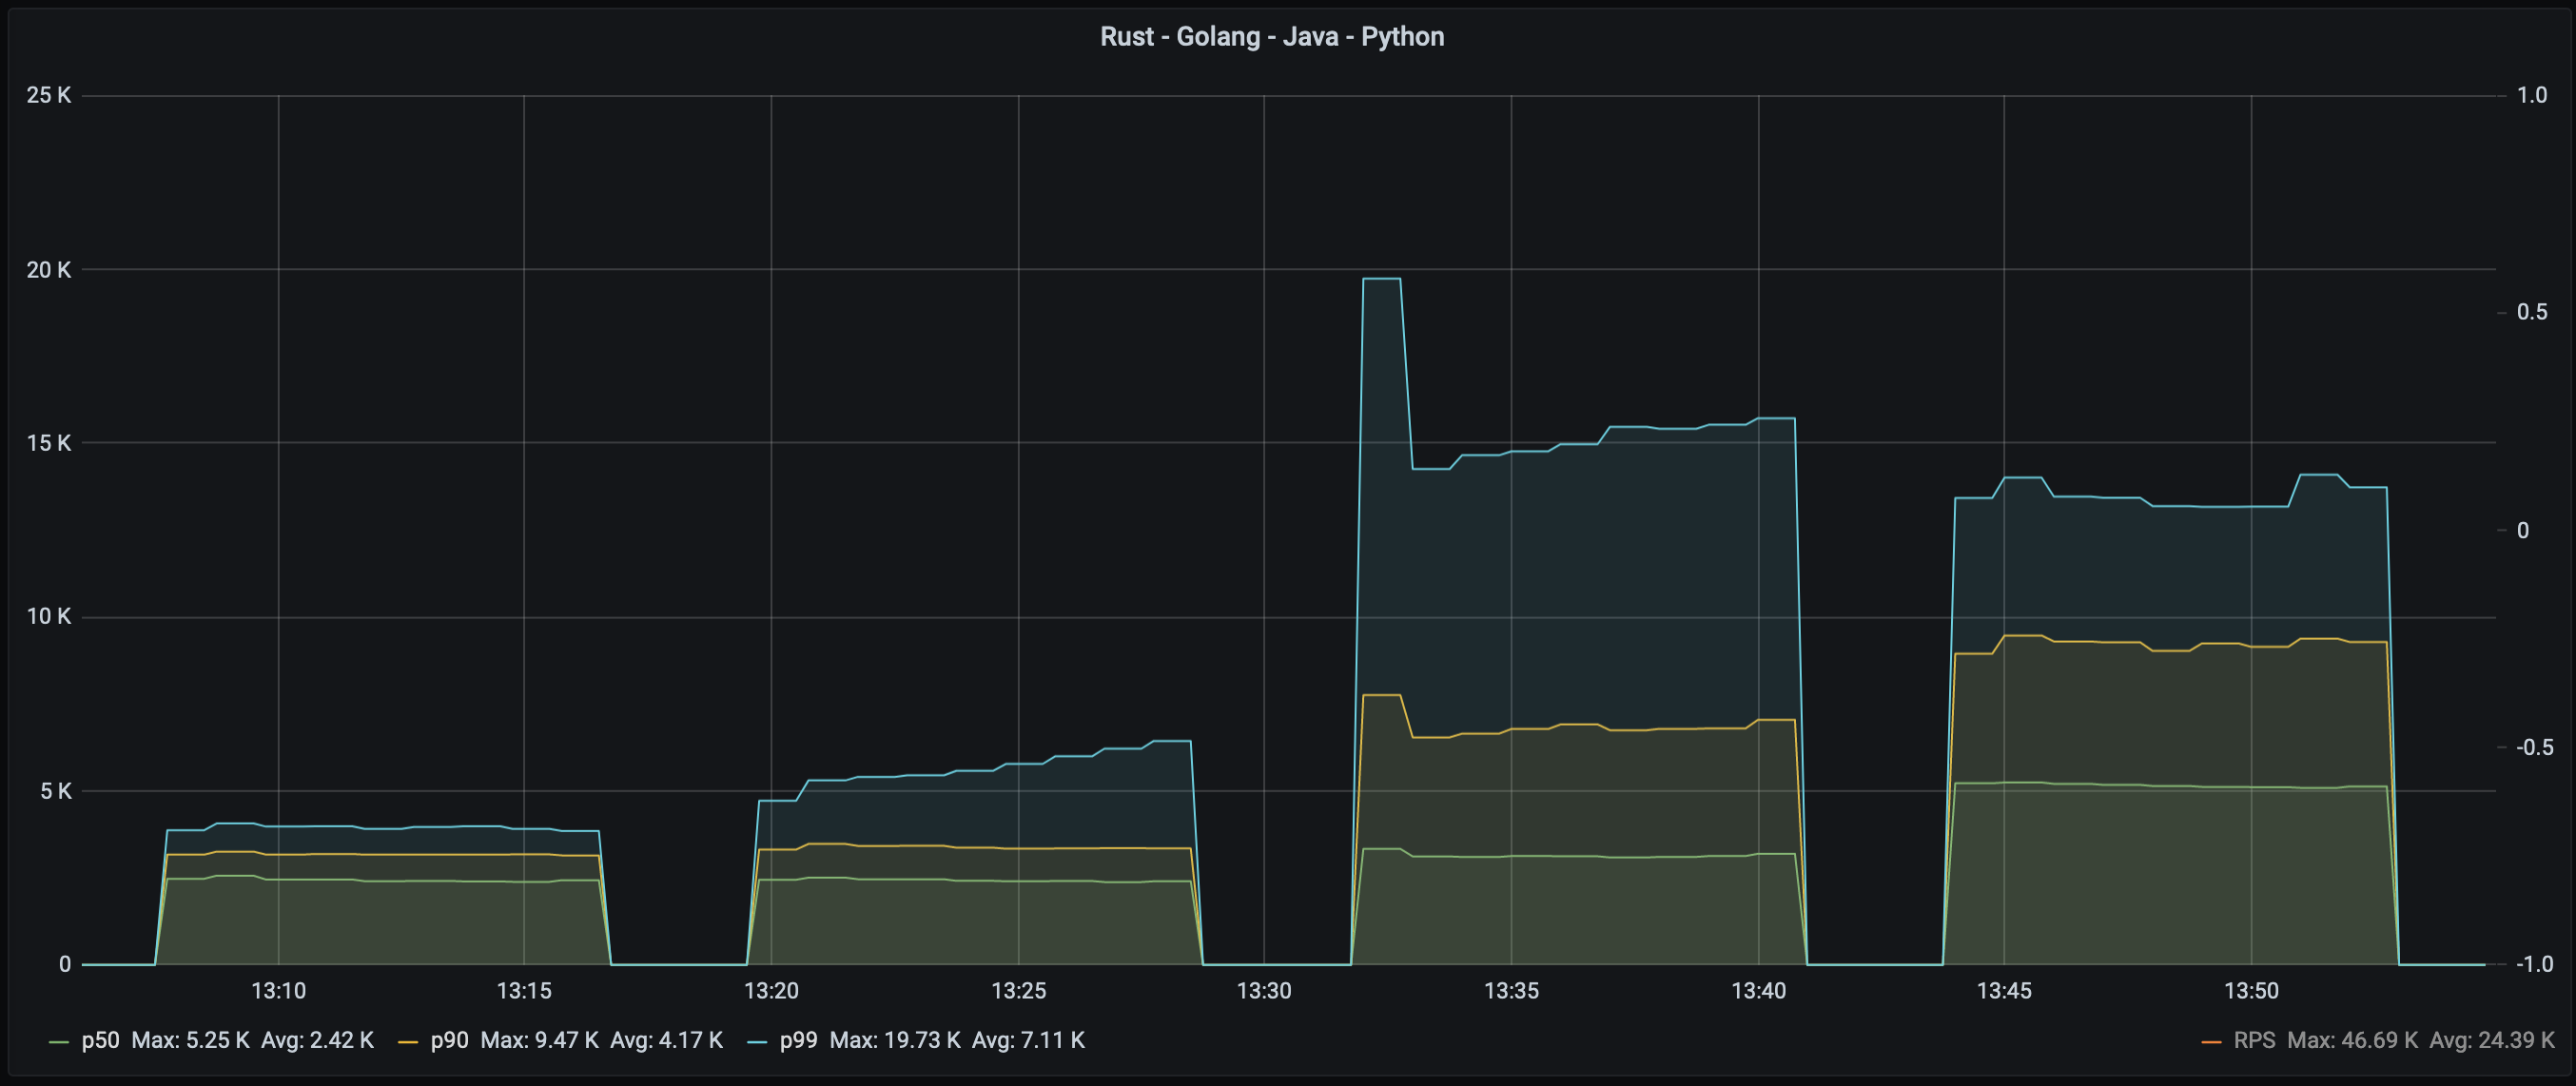
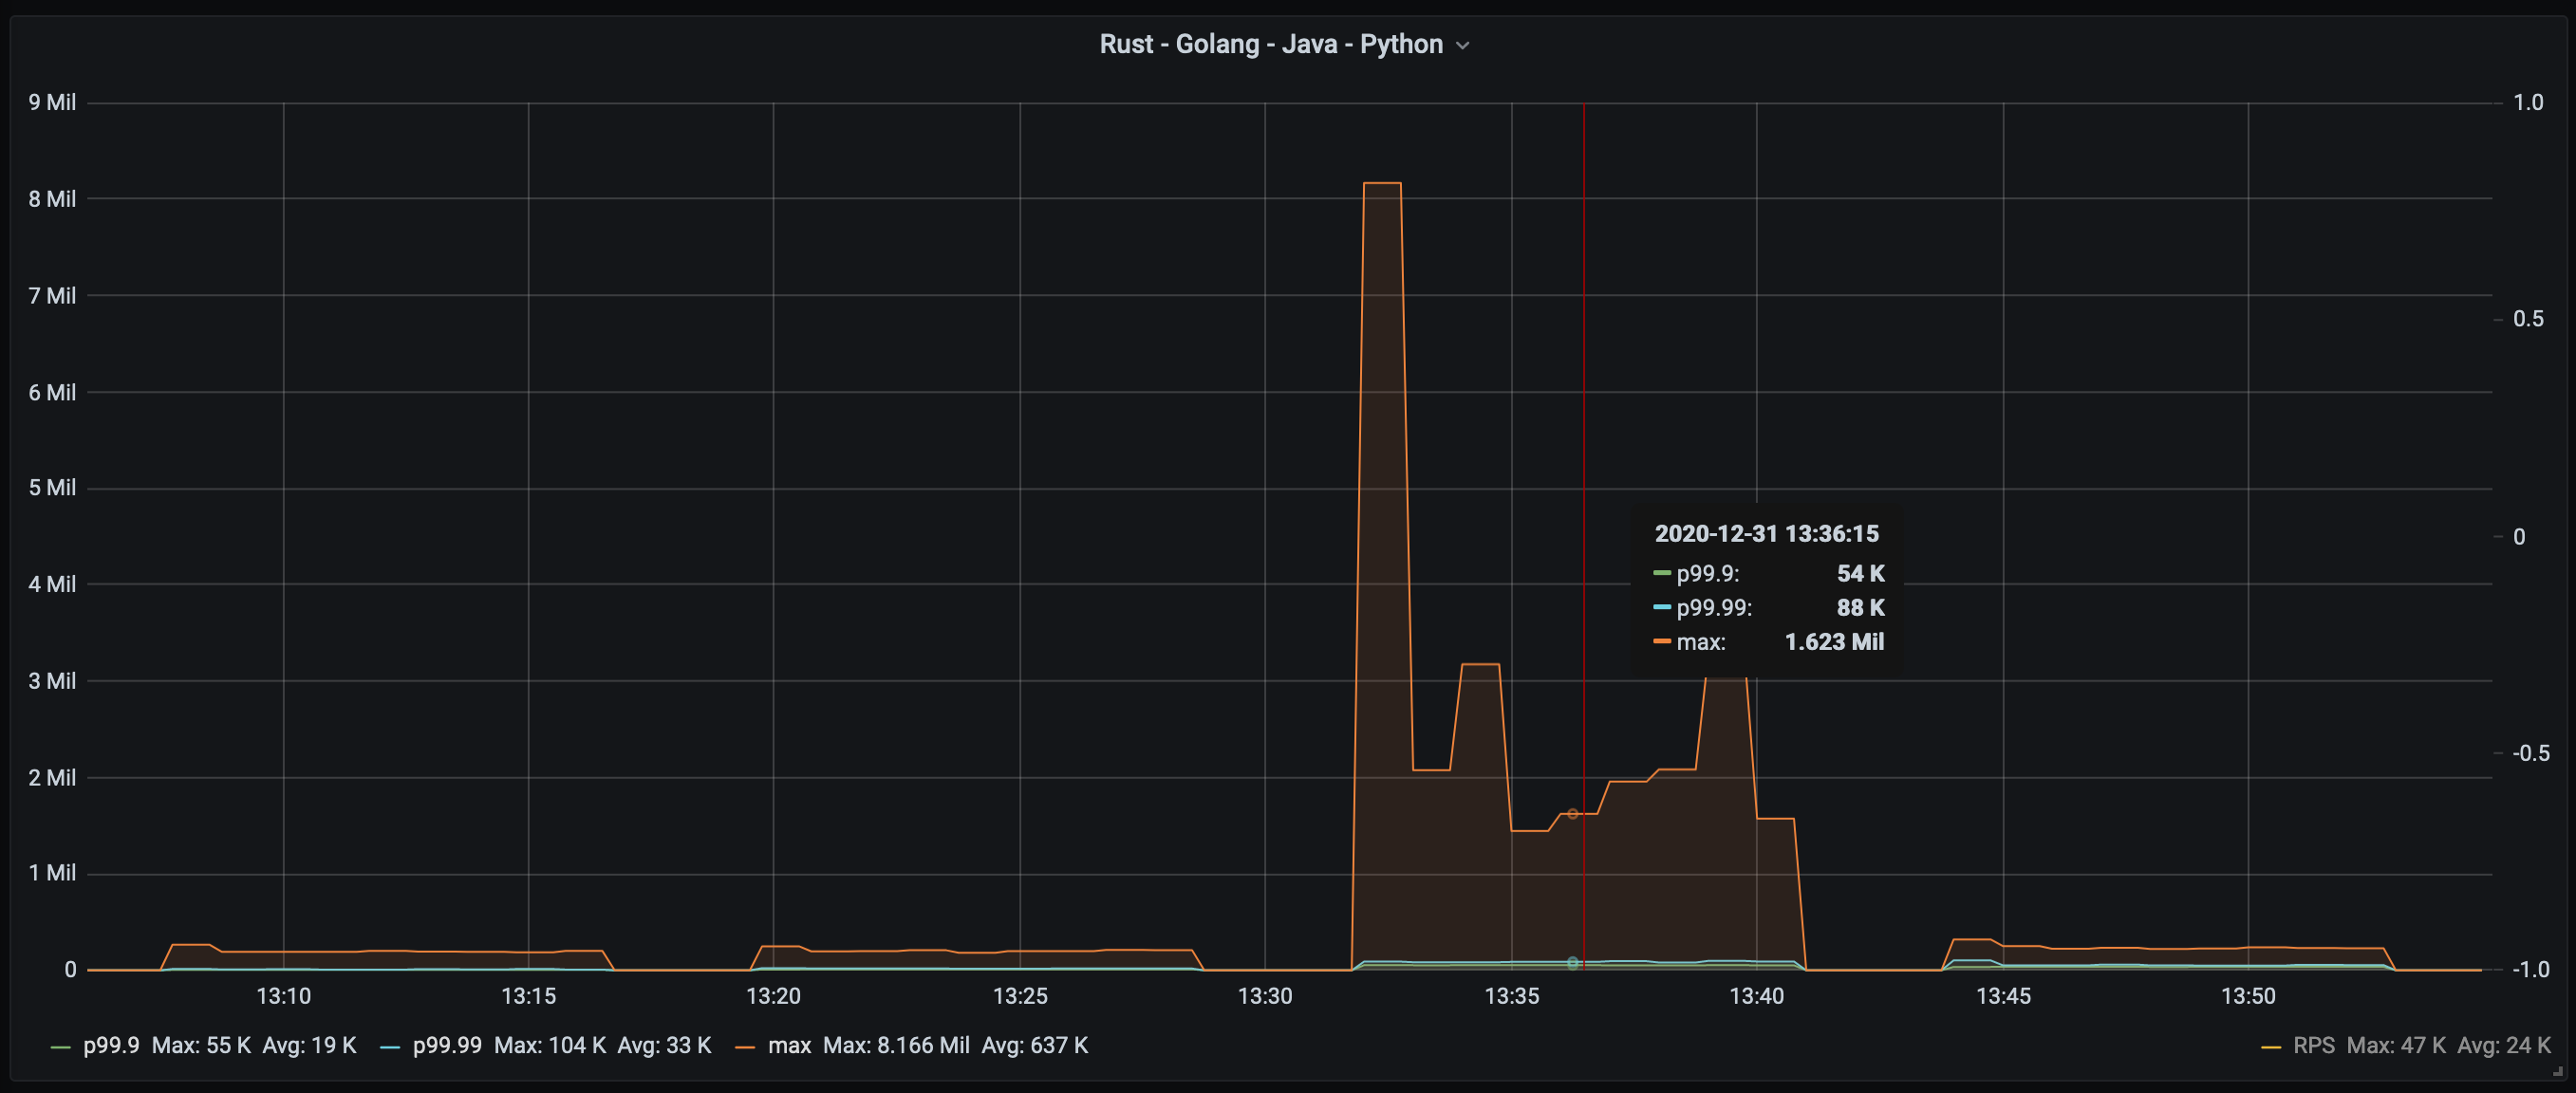
Outlier latency shows an even larger difference with Rust, and for Java is the worst of all four:
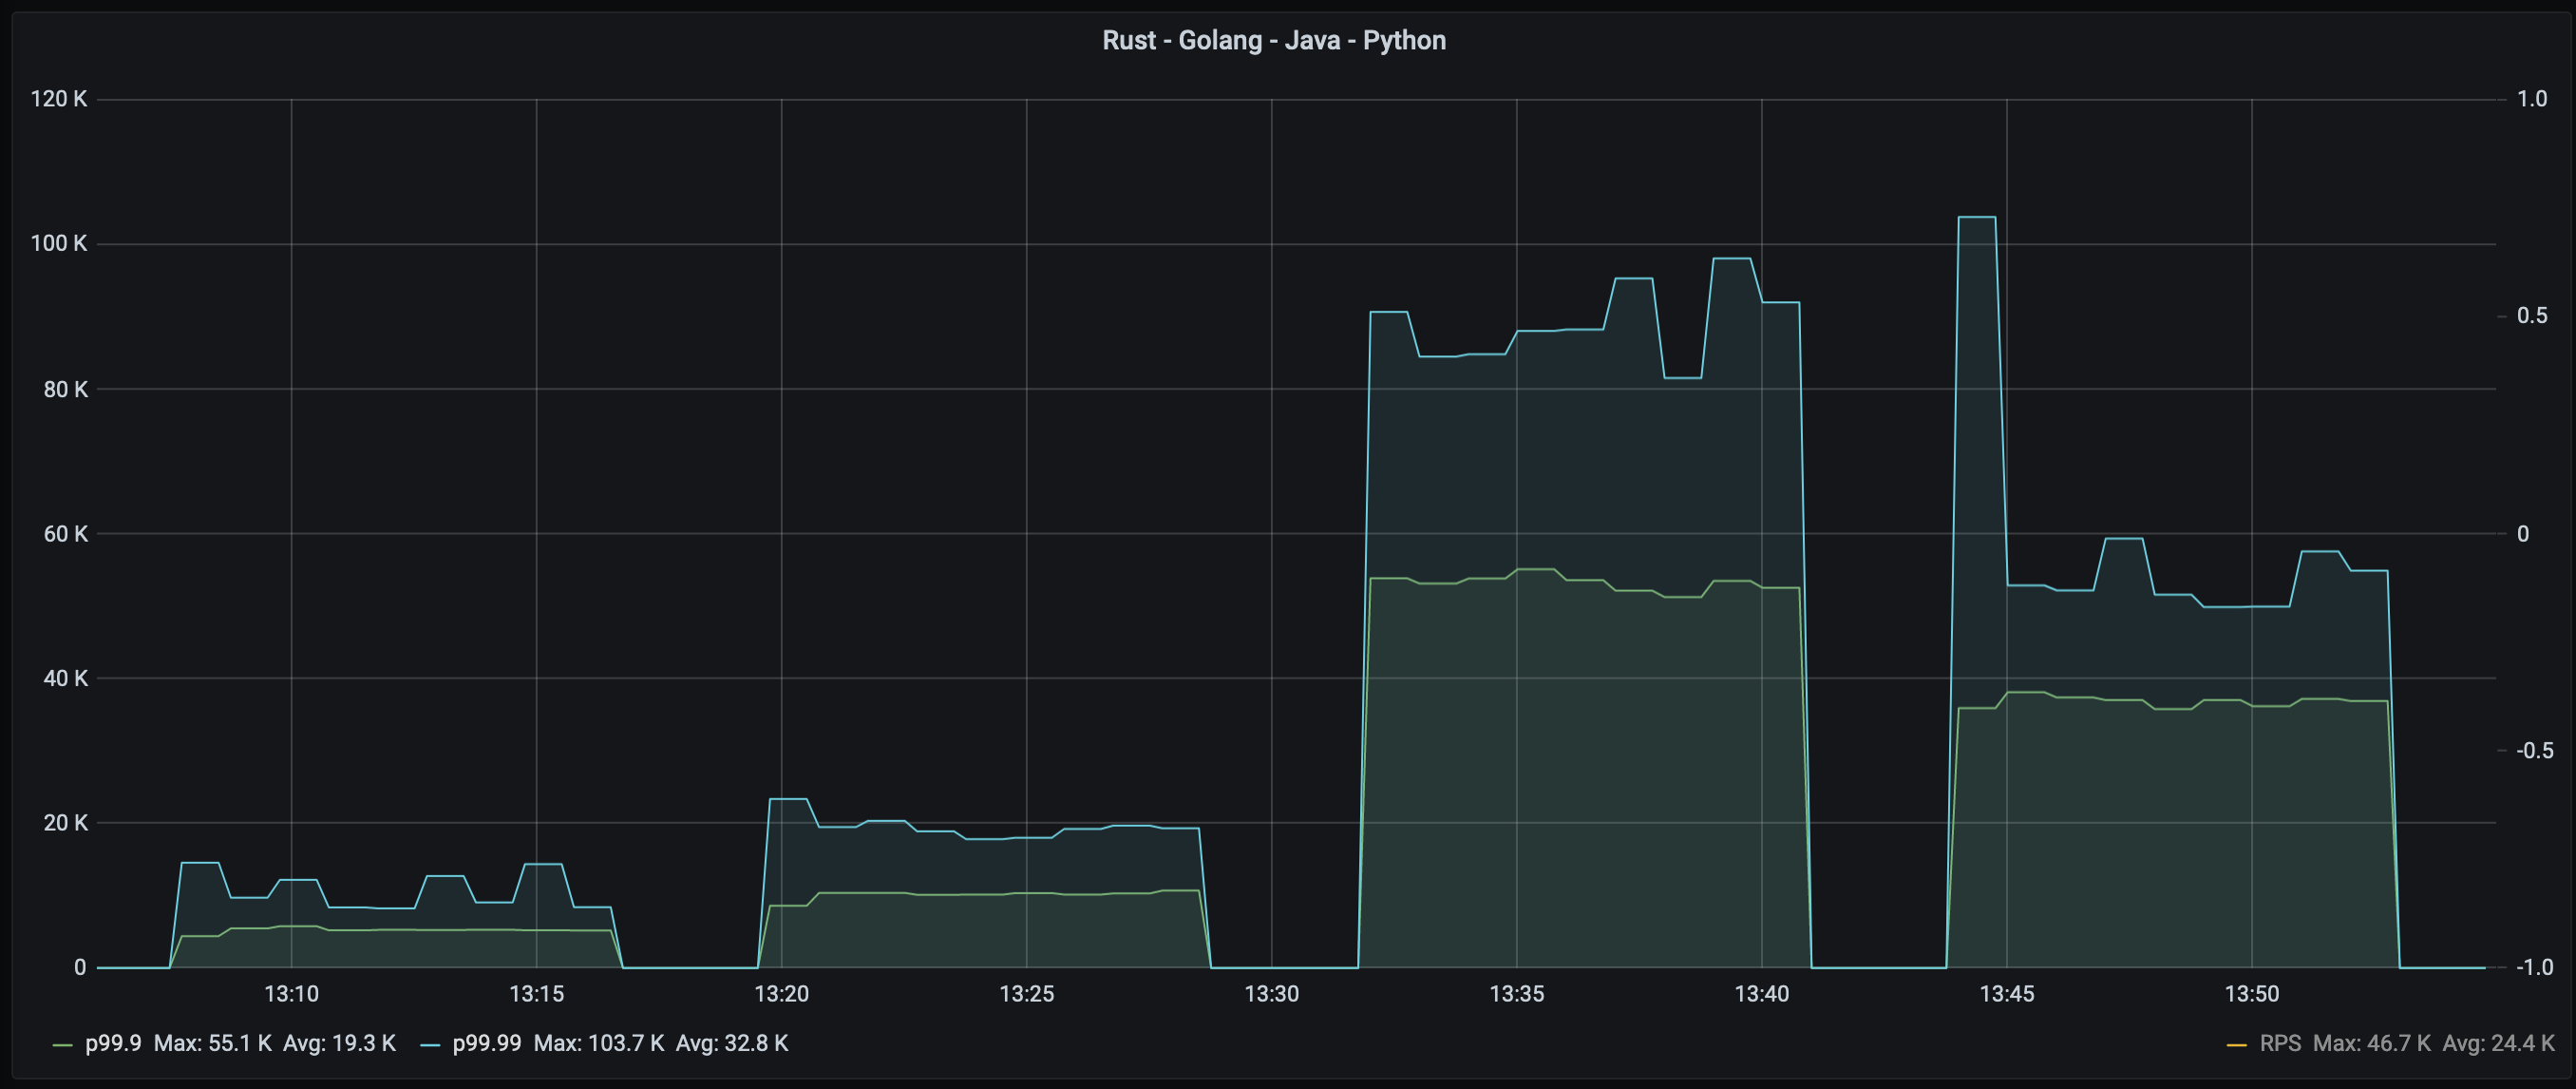
Golang's is comparable to Rust, which is impressive.
Again, Java and Python are well behind both Rust and Golang:
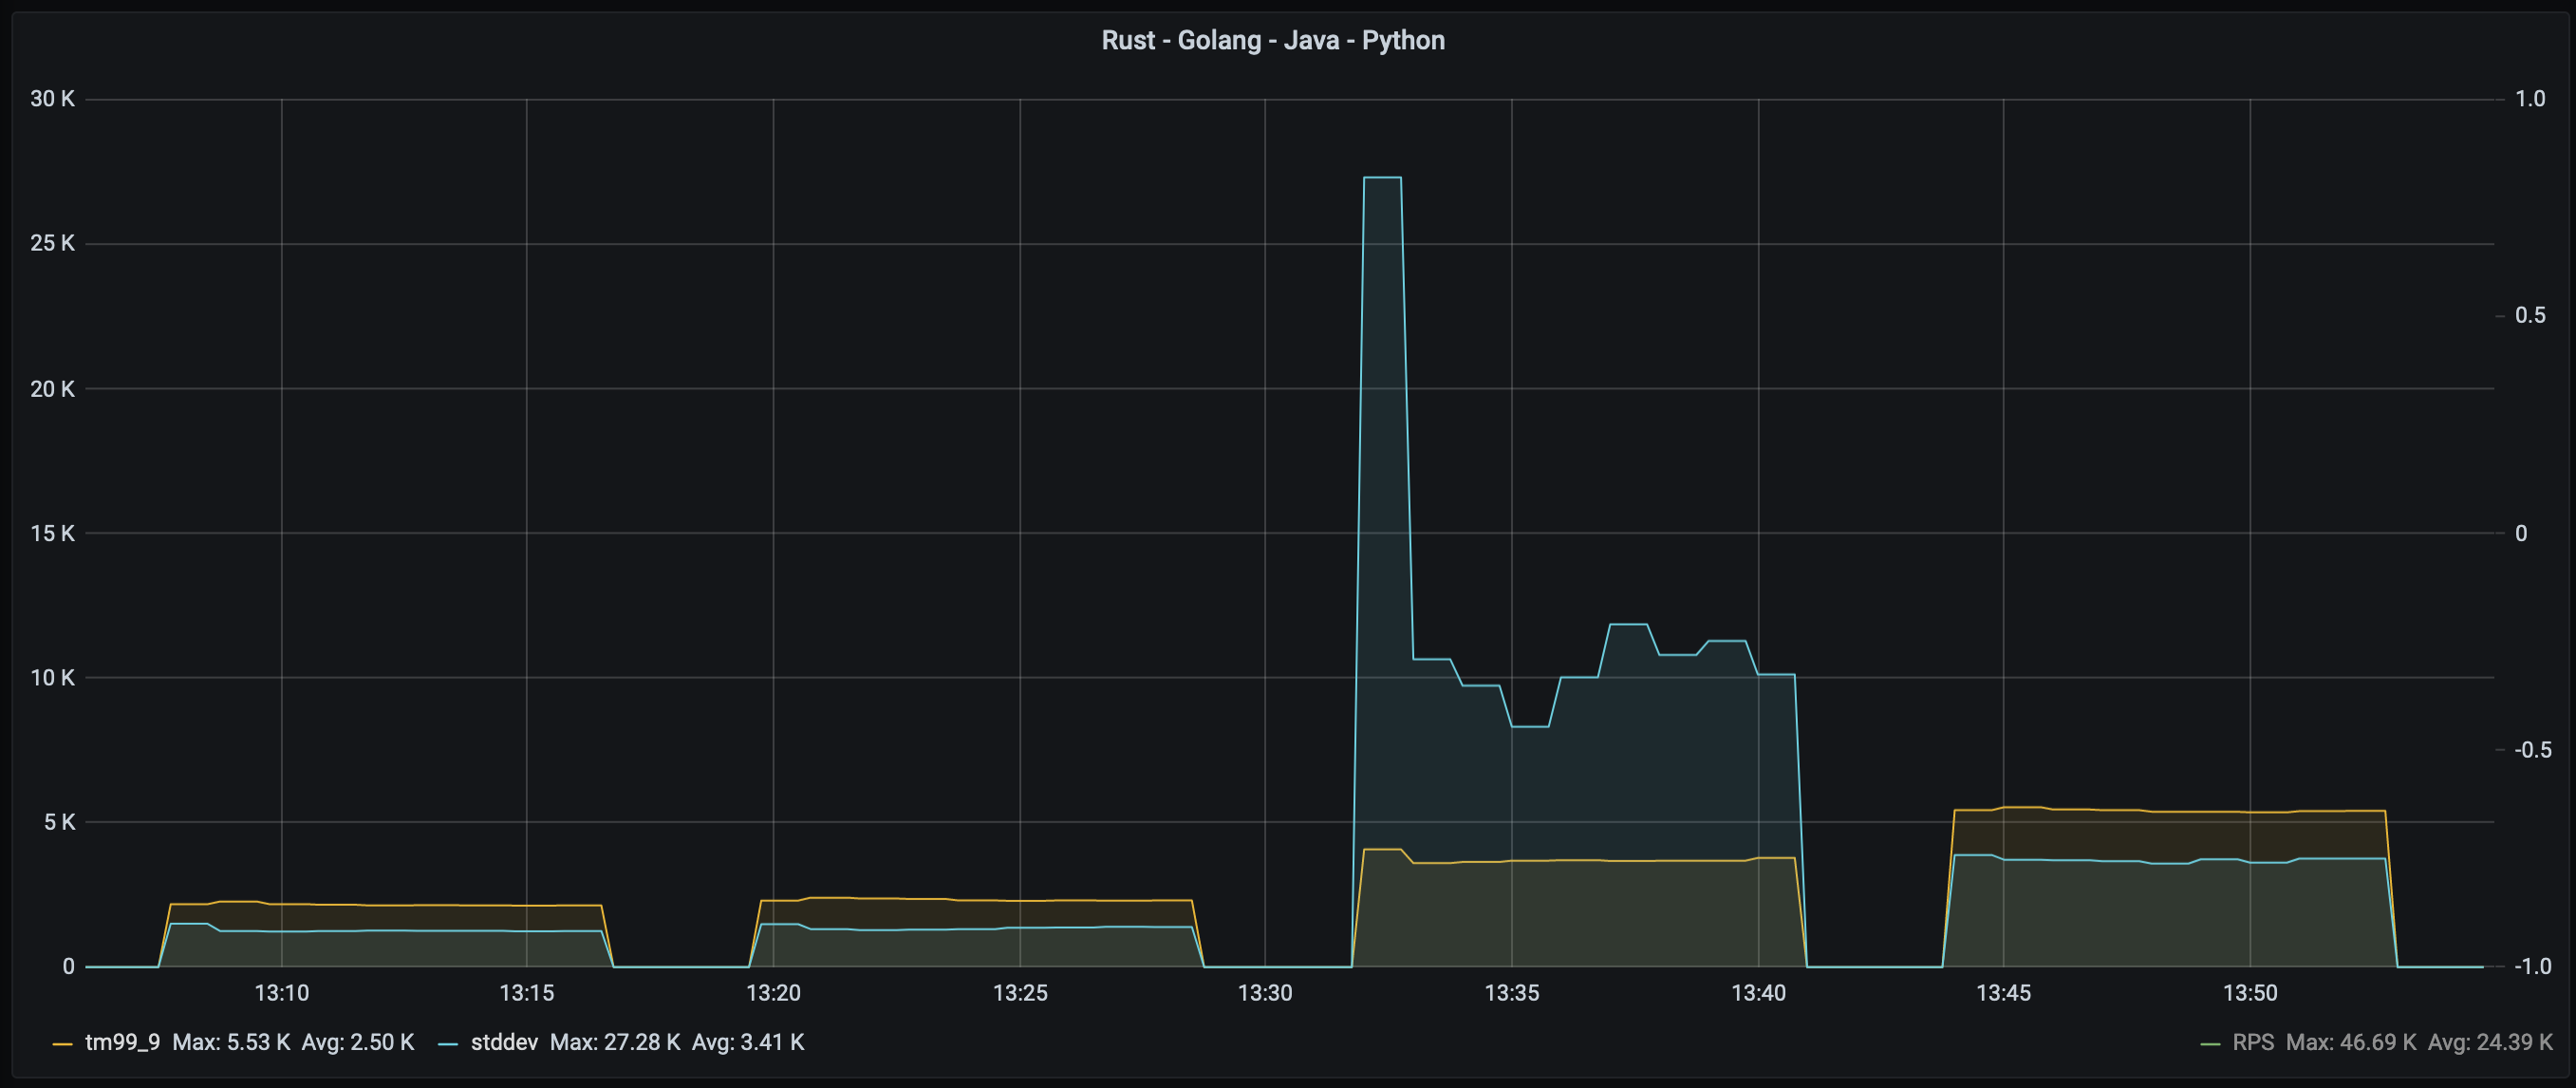
CPU utilization is important here. What we want is to saturate the CPU as much as we can.
As we can see, Rust does the best job of utilizing resources while Golang, Java, and Python (in this order) allow more power to stay idle.
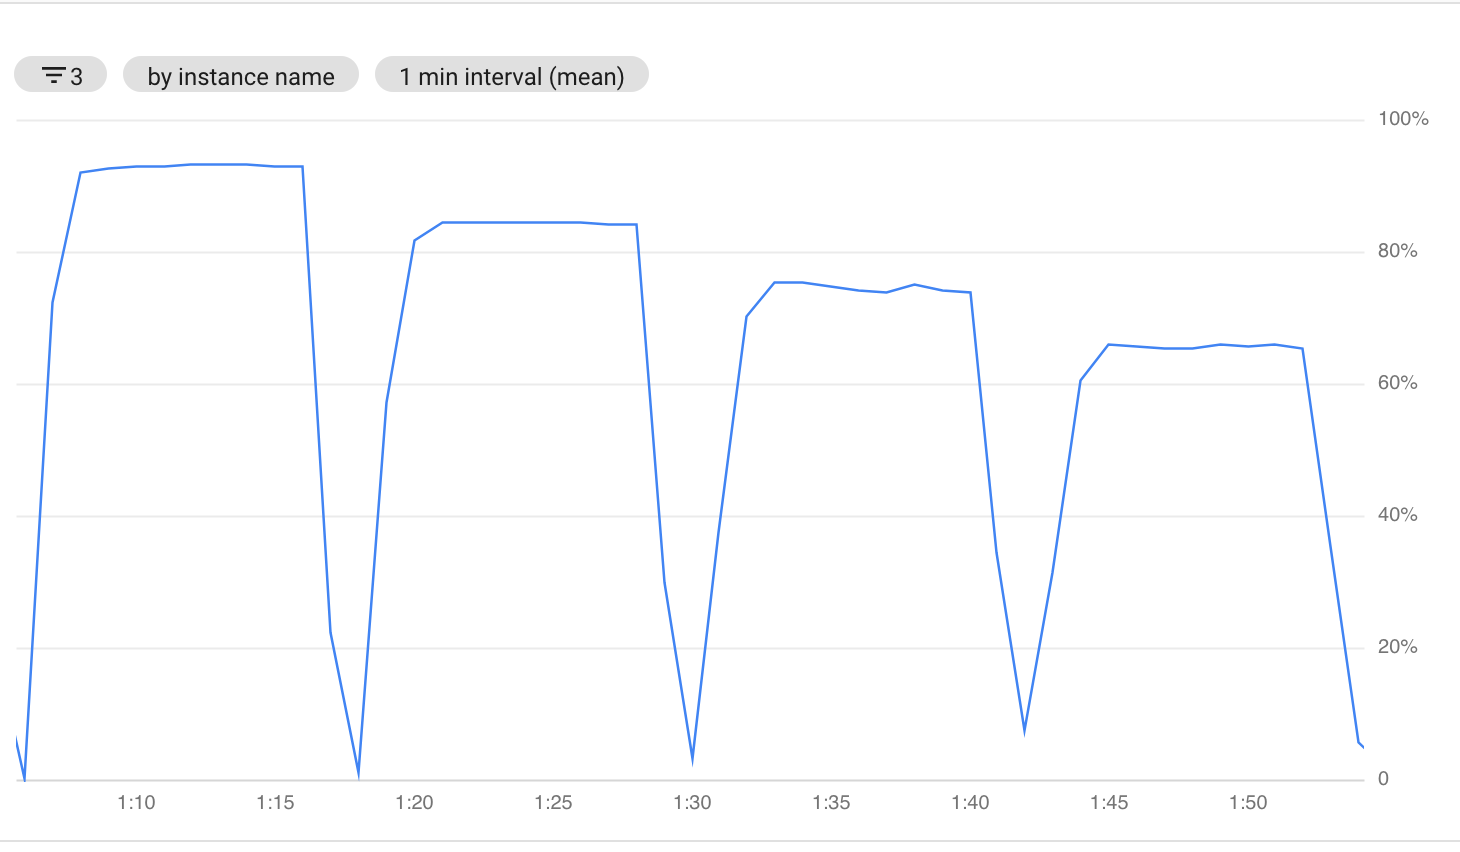
| CPU Utilization | |
|---|---|
| Rust | 93% |
| Golang | 84% |
| Java | 74% |
| Python | 65% |
| p50 | p90 | p99 | p99.9 | p99.99 | max | tm99.9 | stddev | rps (k) | |
|---|---|---|---|---|---|---|---|---|---|
| Rust (http-tunnel) | 2.4 | 3.2 | 3.9 | 5.2 | 10.8 | 202.5 | 2.2 | 1.3 | 46 |
| Tcp-Proxy (Golang) | 2.4 | 3.4 | 5.7 | 10.1 | 19.6 | 206.6 | 2.3 | 1.4 | 42.6 |
| NetCrusher (Java) | 3.1 | 6.9 | 15.6 | 53.2 | 89.1 | 2,850 | 3.7 | 12.3 | 25.9 |
| pproxy (Python) | 5.2 | 9.2 | 13.5 | 36.8 | 59.2 | 242.7 | 5.4 | 3.7 | 18.3 |
| p50 | p90 | p99 | p99.9 | p99.99 | max | tm99.9 | stddev | rps (k) | |
|---|---|---|---|---|---|---|---|---|---|
| Baseline | 1.8 | 2.9 | 3.4 | 3.9 | 9.0 | 202.6 | 1.6 | 1.2 | 60.4 |
| C (HAProxy) | 2.5 | 3.3 | 4.1 | 5.4 | 13.4 | 191.2 | 2.2 | 1.3 | 45.3 |
| C++ (draft-http-tunnel) | 1.9 | 3.2 | 5.3 | 9.2 | 18.9 | 205.4 | 2.0 | 1.2 | 48.8 |
| Rust (http-tunnel) | 2.4 | 3.2 | 3.9 | 5.2 | 10.8 | 202.5 | 2.2 | 1.3 | 46 |
| Tcp-Proxy (Golang) | 2.4 | 3.4 | 5.7 | 10.1 | 19.6 | 206.6 | 2.3 | 1.4 | 42.6 |
| NetCrusher (Java) | 3.1 | 6.9 | 15.6 | 53.2 | 89.1 | 2,850 | 3.7 | 12.3 | 25.9 |
| pproxy (Python) | 5.2 | 9.2 | 13.5 | 36.8 | 59.2 | 242.7 | 5.4 | 3.7 | 18.3 |
The Rust solution is on par with C/C++ solutions at all levels. Golang is slightly worse, especially for tail latencies, but is close to high-performance languages.
NetCrusher and pproxy have much worse throughput and latency characteristics if a network service is under heavy load. But, NetCrusher (Java) showed the worst max latency measured in seconds:
BTW, try to guess Java on the memory consumption graph:
