-
Notifications
You must be signed in to change notification settings - Fork 56
Part 4. Add a Map to Your Dashboard
Elizabeth Adams edited this page Nov 26, 2018
·
10 revisions
 We can easily add a map tile to our dashboard showing the location of our weather stream. You can learn more about the interactive map view in tiles at the support page.
 You need to get the latitude/longitude coordinates of your location. One way to do this is to go to Google Maps, search for your location, and zoom in to your exact location. In the URL, you will see your latitude/longitude coordinates. In the example above, my coordinates are 35.925298,-86.8679478. Copy your coordinates (you will need them in step 2), and make sure you don't accidentally copy any extra characters from the URL.
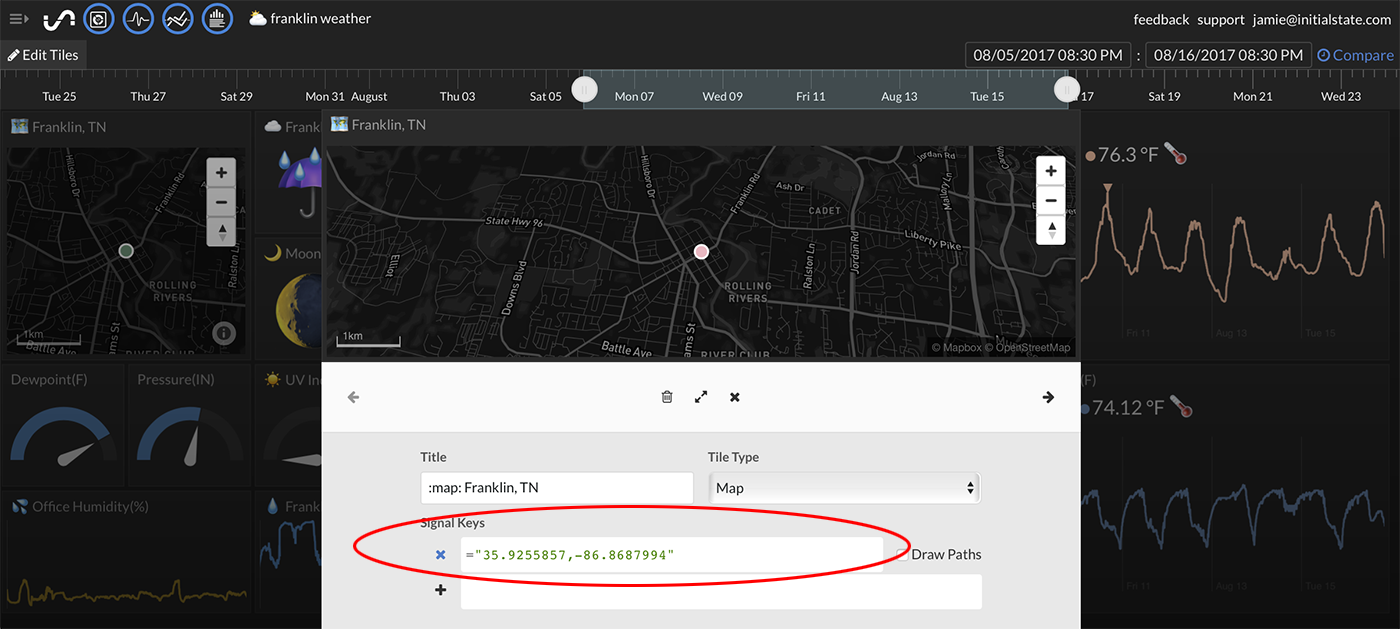
- Click on the Edit Tiles link at the top left of your dashboard and select +Add Tile.
- Select the Tile Type to be Map.
- Paste the map coordinates inside of a real-time expression constant assignment (e.g. ="35.9255857,-86.8687994").
- The map should zoom into the location specified and show a dot at that exact latitude/longitude coordinate.
<< Part 3: Sense HAT Temperature Correction - Part 5: (Bonus) Configure Your Own Weather Alerts >>
