MicroPython: DHT11
The DHT11 is a temperature and humidity sensor.

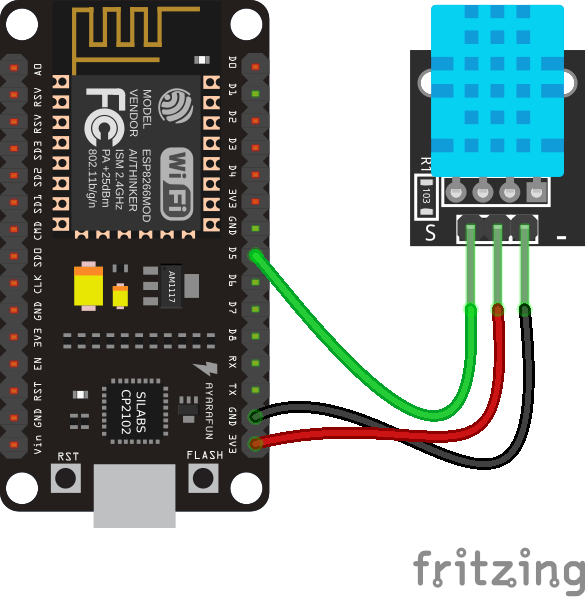
>>> from machine import Pin
>>> from dht import DHT11
>>> d = DHT11(Pin(14))
>>> d.measure()
>>> d.temperature()
28
>>> d.humidity()
16
Logging the data with Phant
Download the server
$ sudo npm install -g phant
Start the server
$ phant
phant http server running on port 8080
phant telnet server running on port 8081
Go to the browser and open the http://localhost:8080, then click on Create a data stream. Complete the Title with "ESP8266 Weather" and the Description with "ESP8266 Weather Station" for the new data stream and put the following fields: temperature and humidity. Then save and copy the public and private key (or download the keys as a JSON file).
MicroPython has urequest which is very small port from the Python Requests lib.
According the Phant documentation the curl to send data is:
$ curl -X POST 'http://PHANT_HOST/input/PUBLIC_KEY' \
       -H 'Phant-Private-Key: PRIVATE_KEY' \
       -d 'temperature=24.1&humidity=40.2'
So to get this with urequest you have to do the following
import urequests

url = 'http://%s/input/%s?temperature=24.1&humidity=40.2' % (PHANT_HOST, PUBLIC_KEY)
headers = {'Phant-Private-Key': PRIVATE_KEY}
response = urequests.post(url, headers=headers)
You can check the response code and reason as following
print(response.status_code, response.reason)
See the full code here
Go to the examples/dht11/src/python folder and update the boot.py file with your WiFi essid and password, and the main.py file with the Phant host and keys. Then upload the files with the ampy tool, using the script:
$ bin/put.sh
Then open the Python shell, reboot MicroPython (to load the files) and run the following
$ bin/shell
[Ctrl-D]

...

>>> data = read_sensor()
>>> phant_log(data)
There is a function run() to do this endless
while True:
    data = read_sensor()
    print("Sending data", data)
    phant_log(data)
    time.sleep(60)

You can make graphs with Google Charts, just open the html/weather.html example file changing the phant_host and public_key variables according to your settings.
