This project is a JavaScript implementation of the Splatterplot interface described by Adrian Mayorga and Michael Gleicher in their TVCG submission entitled Splatterplots: Overcoming Overdraw in Scatter Plots. A short demonstration of the architecture of this project was presented at the Data Systems for Interactive Analysis workshop at IEEE VIS 2015, and details can be found in our workshop paper titled Using WebGL as an Interactive Visualization Medium: Our Experience Developing SplatterJs.
The JavaScript implementation utilizes WebGL to bring Splatterplots to the web browser. When deployed on a server, the interface allows for analysts to upload their data files, select the dimensions to display on the splatterplot, and plot the data. The analyst then has the ability to pan and zoom around the data-space to find clusters and correlations between different data series.
An assorted collection of example datasets loaded into SplatterJs. Please be aware that the URI may change in the future as SplatterJs finds a more permanent home. You are also welcome to upload your own text-based, comma-separated value files to the visualization; the Load File dialog allows for picking the relevant dimensions and a label column to group series together.
- Two Gaussians -- The same dataset as is shown in the teaser figure above
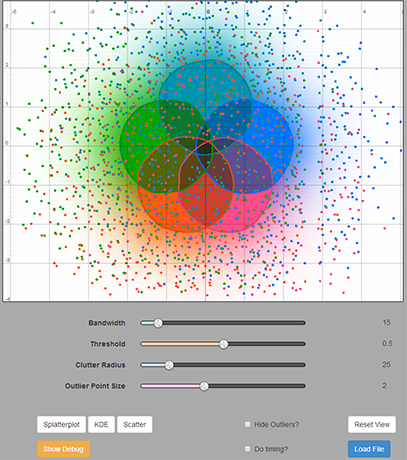
- Five Gaussians -- Showing five Gaussian distributions comprising 250,000 2D points (50k per group)
- FARS 2012 data -- Showing the FARS (Fatality Analysis Reporting System) data for the 2011 year. By clicking on the 'hide grid' and 'show background' checkboxes, a map of the United States is displayed
The main splatterplot.js file is loosely documented with Markdown syntax. Please use docco to generate a side-by-side of code with comments. The following command works well: docco -c docco-modified.css splatterplot.js.
Since SplatterJs depends on using WebGL, only browsers that support WebGL are supported. To get the necessary precision, the OES_texture_float WebGL extension is required. RenderingPipeline.com has a good script to determine which WebGL extensions your browser and computer support.
In its current implementation, SplatterJs manages 9 textures per data series, with nearly 20 texture writes per data series (density map, blurring, GPGPU-based max value, threshold distance calculation [jump flooding], drawing of outliers, shading), as well as the final compositing operation. This entire rendering process is repeated on pan and zoom. It is therefore suggested that the client computer have a modern GPU. A nVidia GeForce 250 or equivalent is the minimum suggested GPU (achieves 3-4 fps); GPUs on the order of an nVidia 770 achieve nearly interactive rates.
SplatterJs uses a multitude of libraries to help it go. Below is a list of the libraries used, their licenses, and how they are used in the system.
- Bootstrap (MIT) -- Used to style and organize UI components on the page, including modal windows.
- jQuery (MIT) -- Used to support Bootstrap and provide event listeners for mouse
- jQuery UI (MIT) -- Supports the operation of sliders
- jquery-mousewheel (MIT) -- Adds normalized support for mousewheel events (zooming on canvas)
- jQuery-File-Upload (MIT) -- Adds ajax-y support for uploading data files
- Hashable.js (none?) -- Adds support for parsing/updating the URL hash to save current viewing state
- lightgl.js (MIT?) -- Provides a nice abstraction layer for doing low-level WebGL commands (e.g. drawing to texture, managing shaders, binding textures)
- kd-tree-javascript (MIT) -- Provides an implementation of k-d trees to answer the question "what points are here?"
Please contact Alper Sarikaya with any comments or questions, or feel free to open an issue or pull request.