Skip to content

Entity Metrics Report in Tableau

Daniel Odievich edited this page May 29, 2020 · 4 revisions

Overview

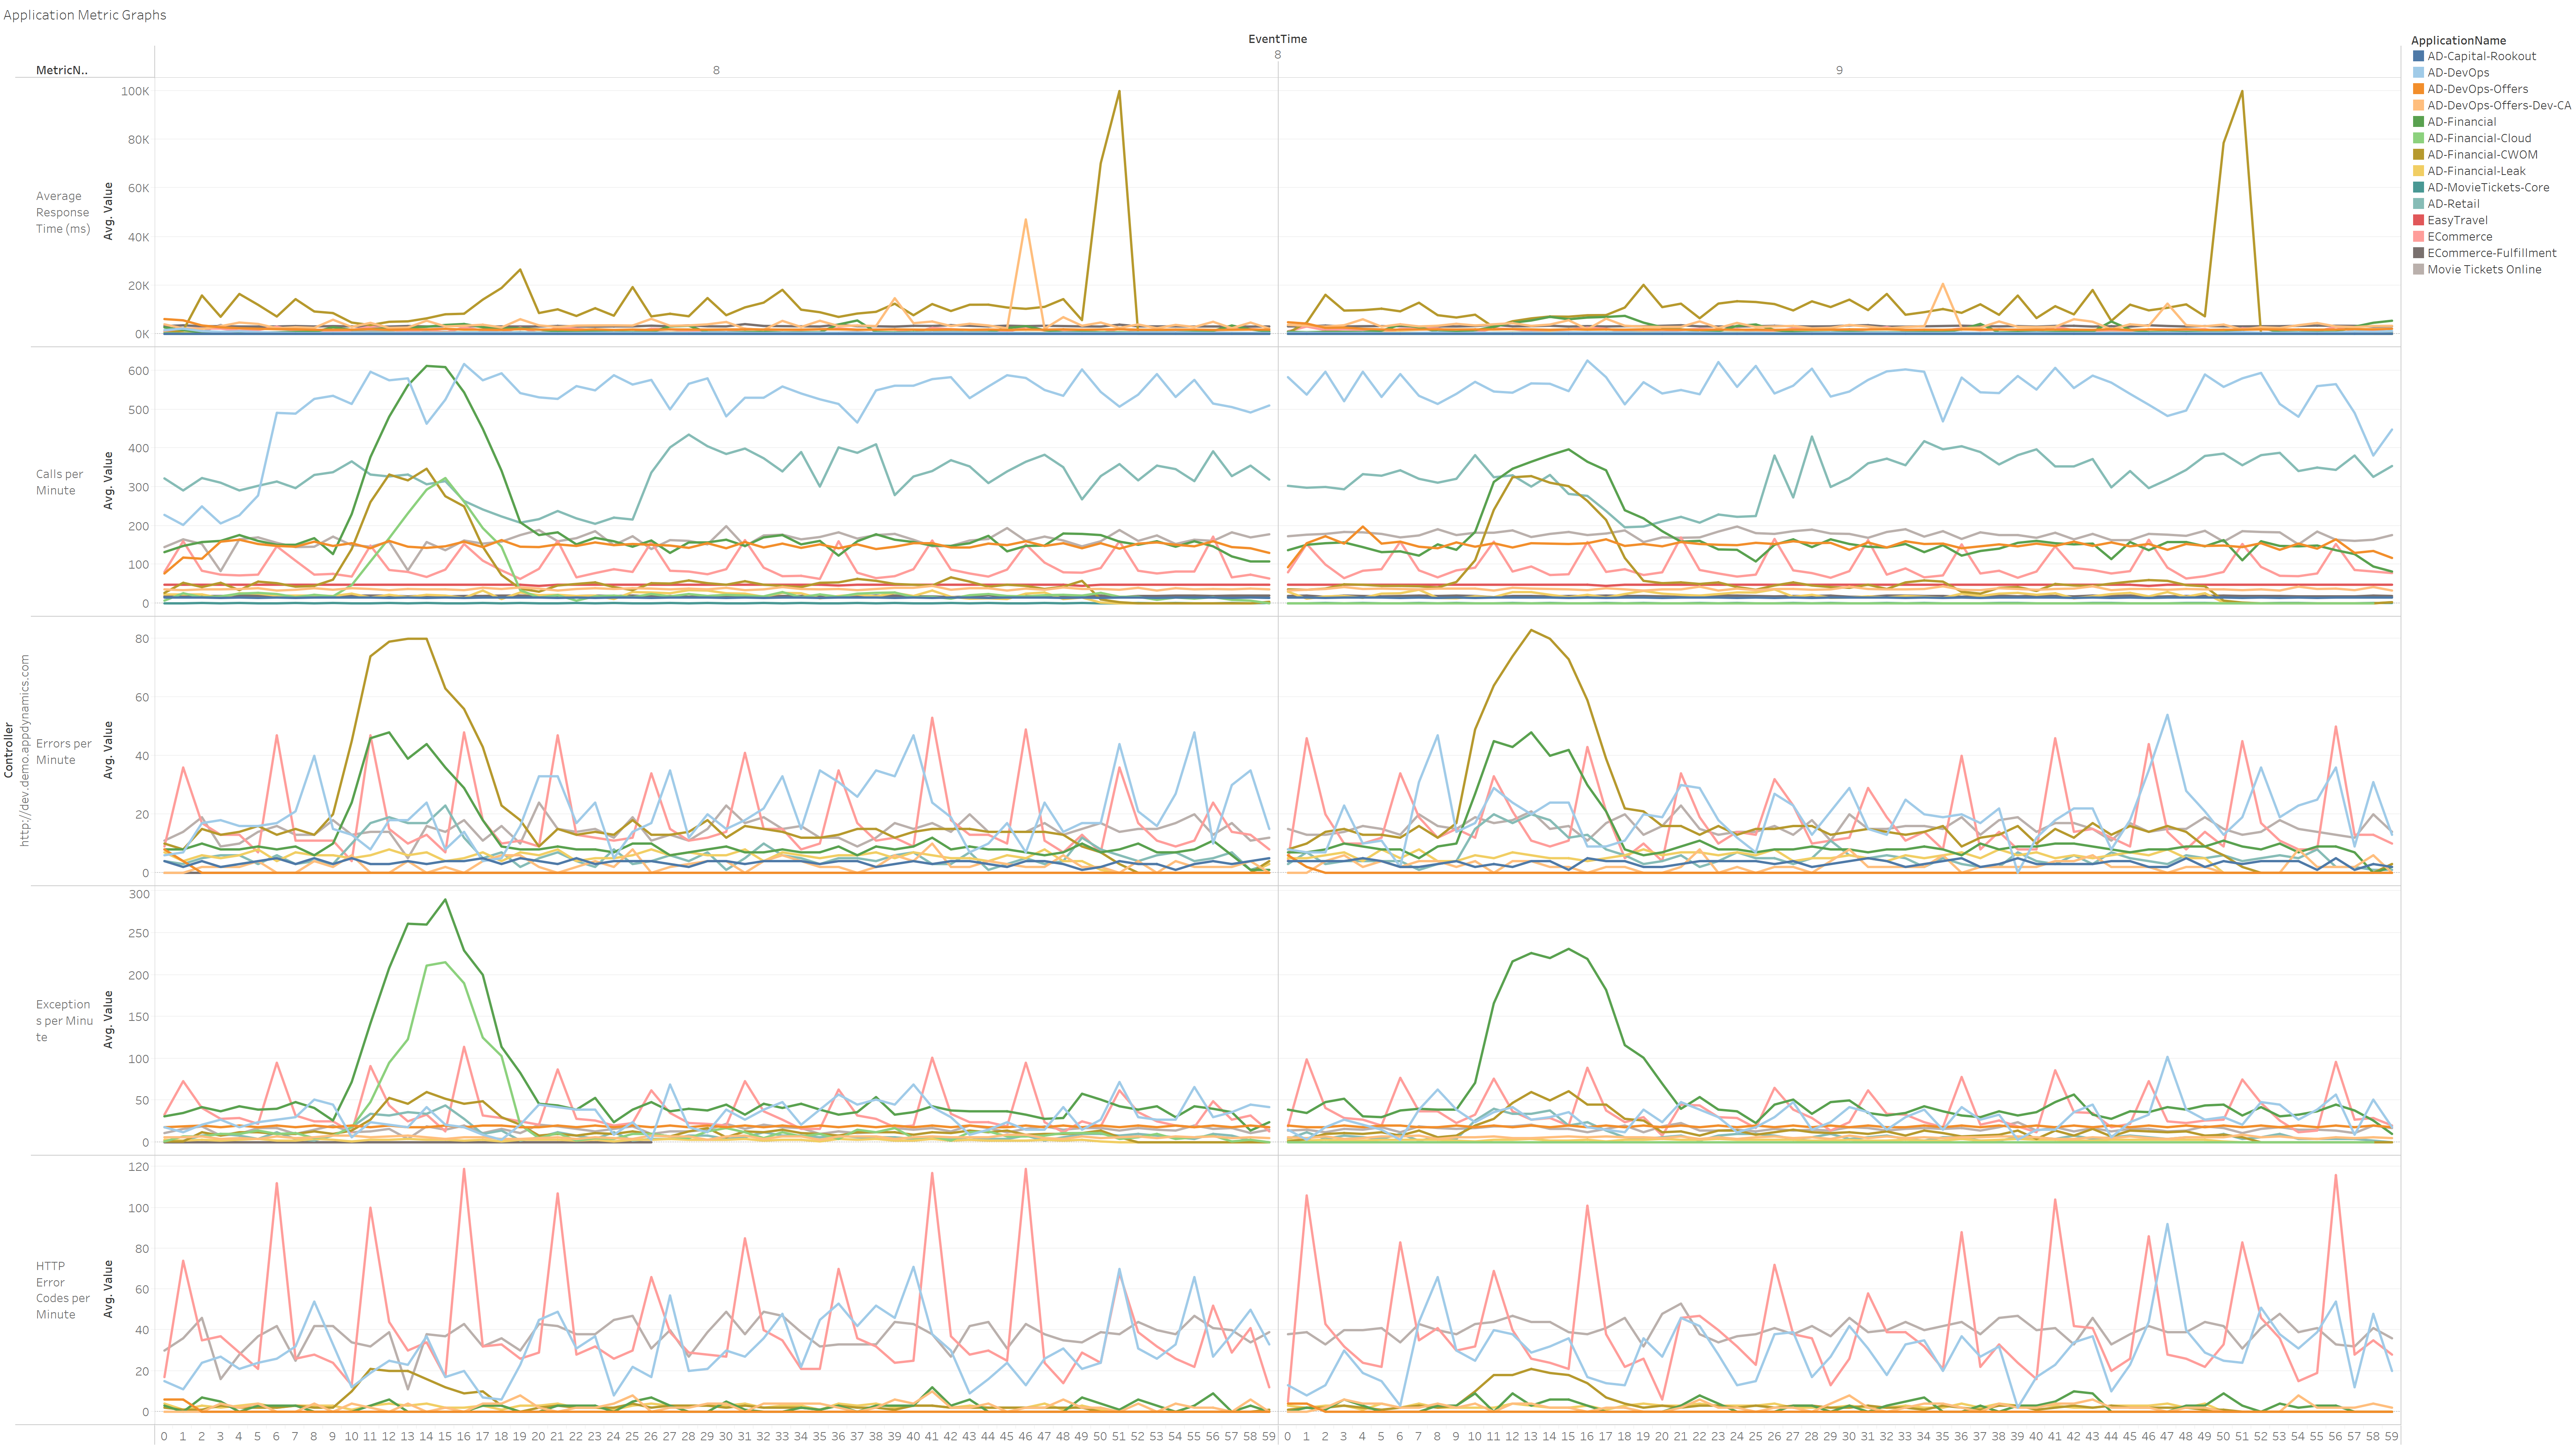
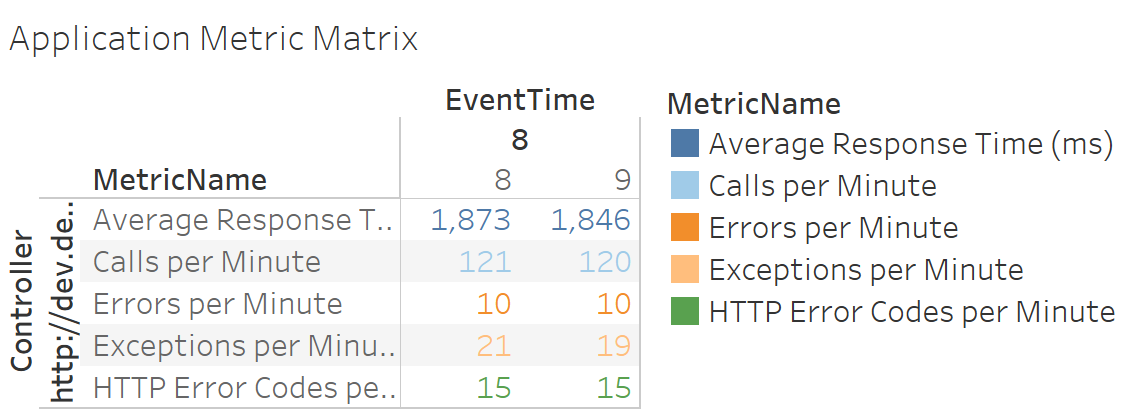
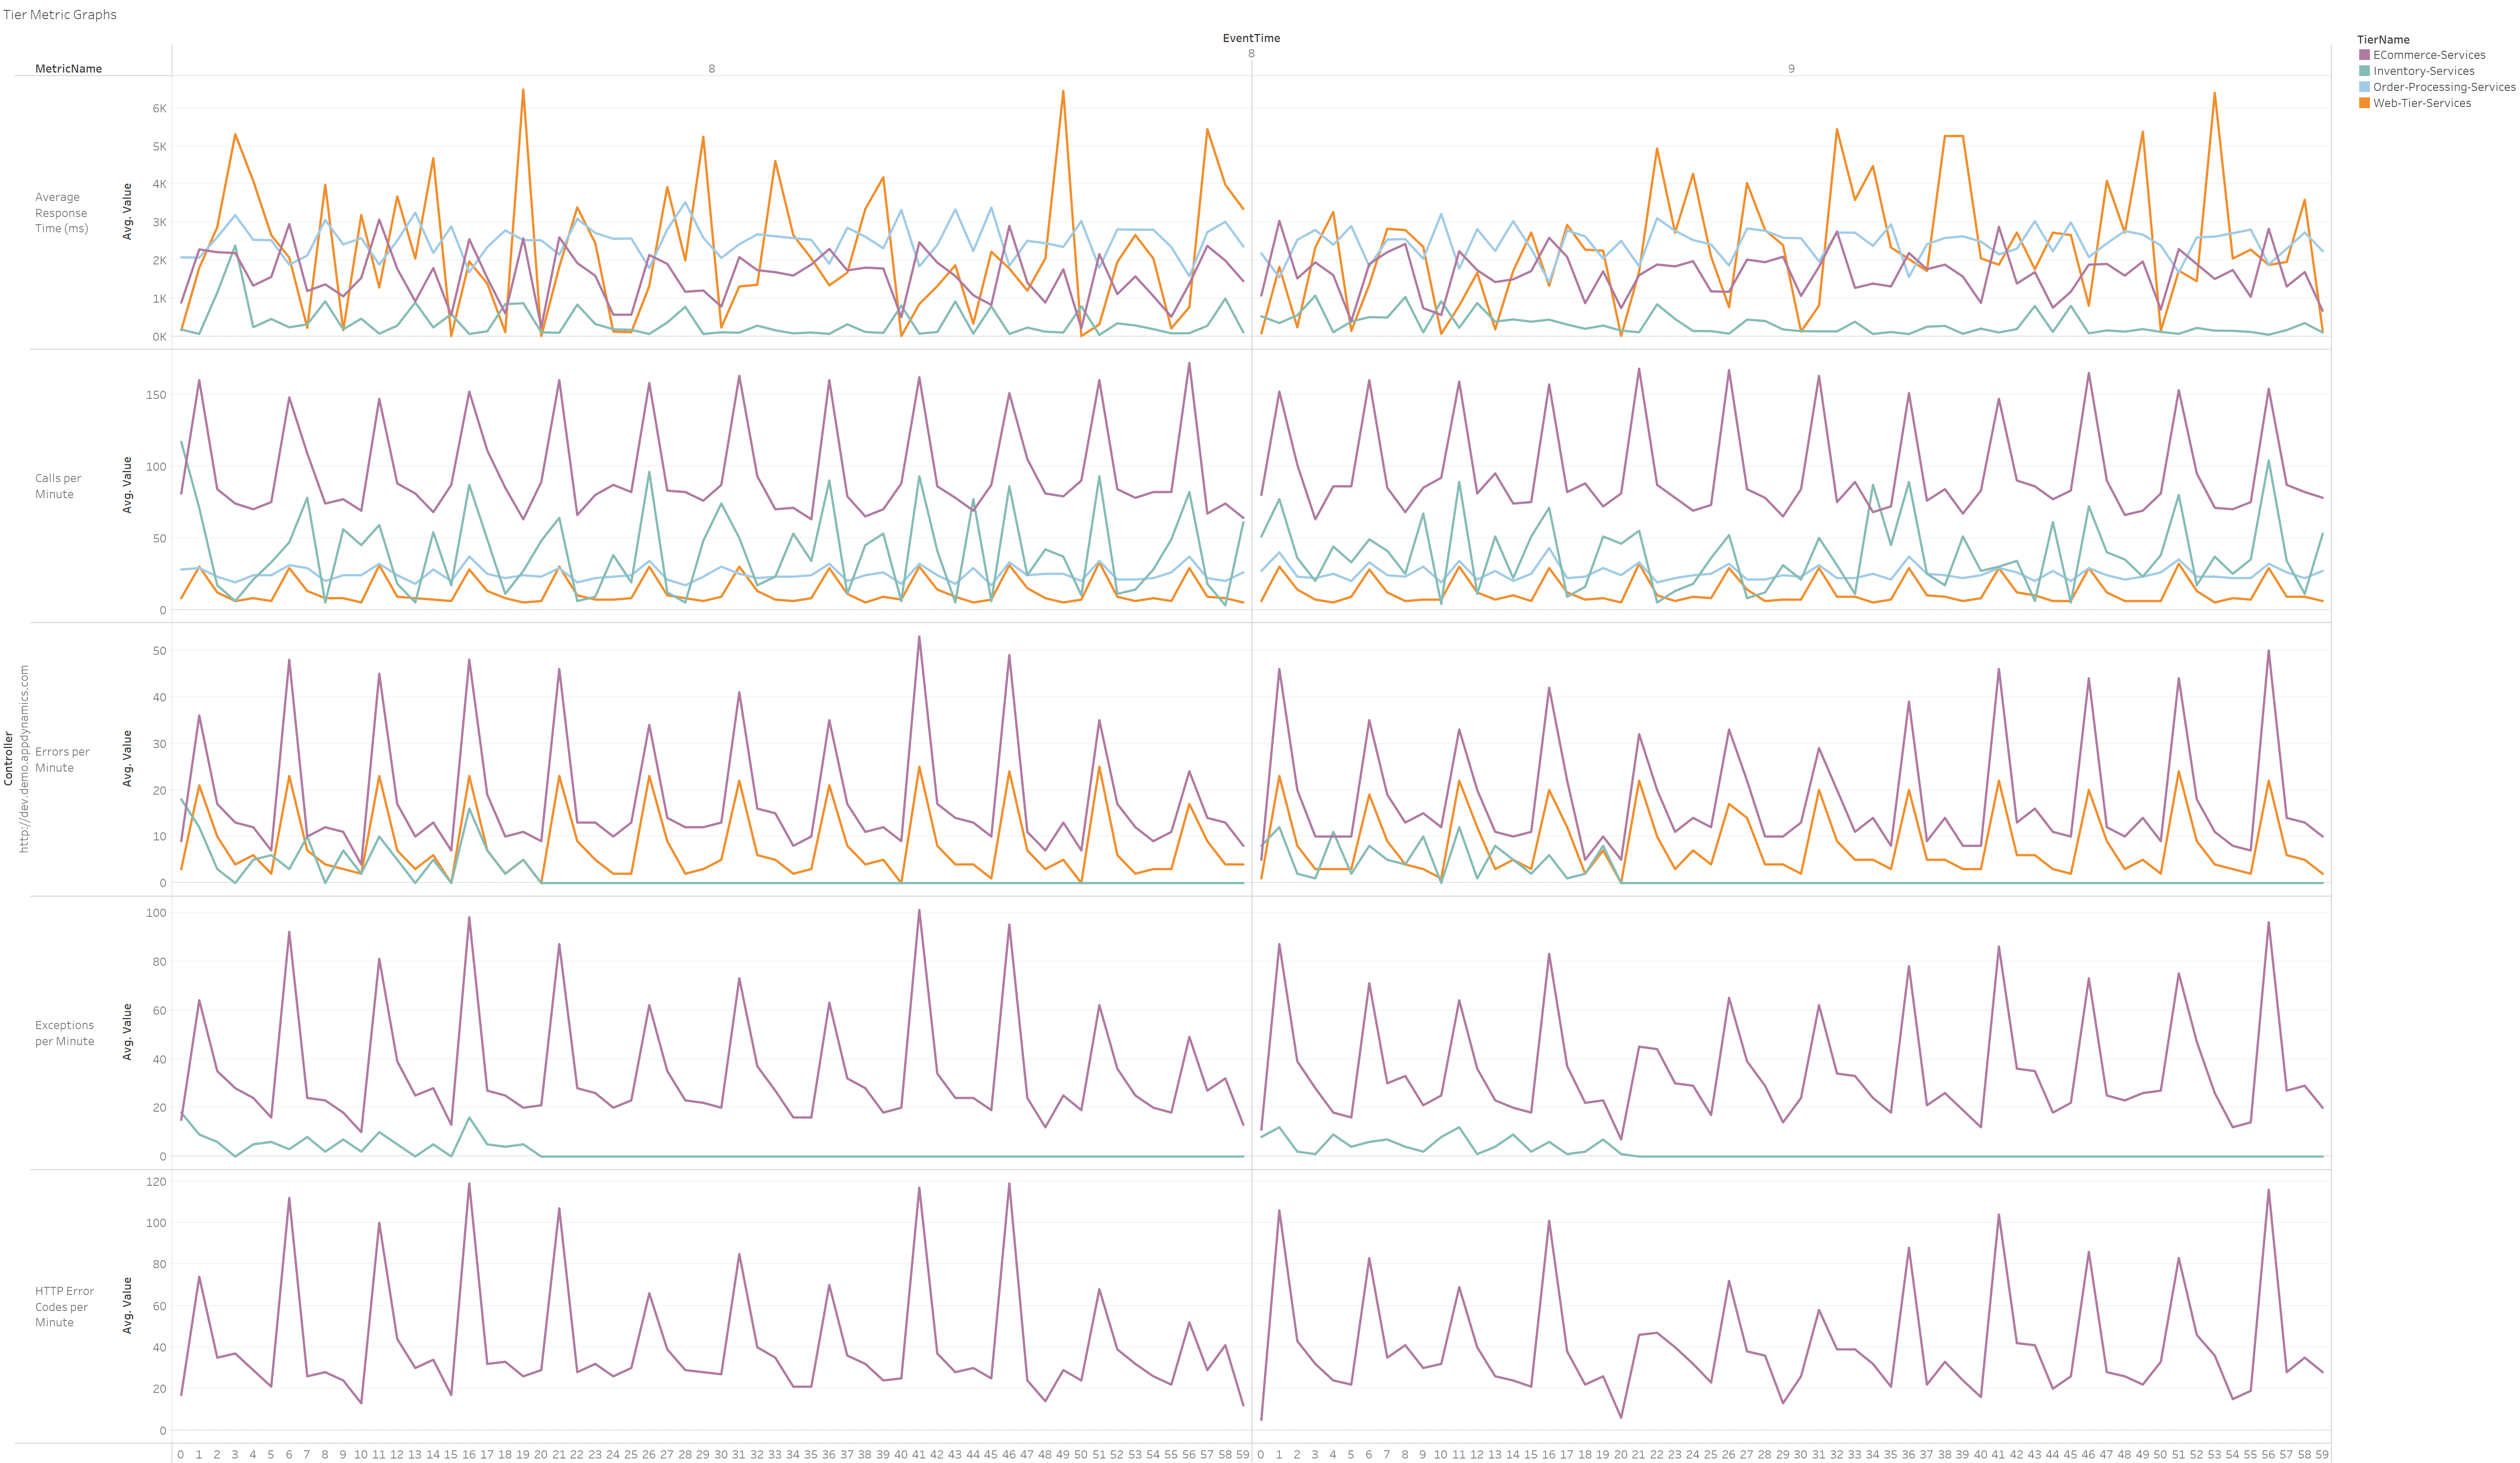
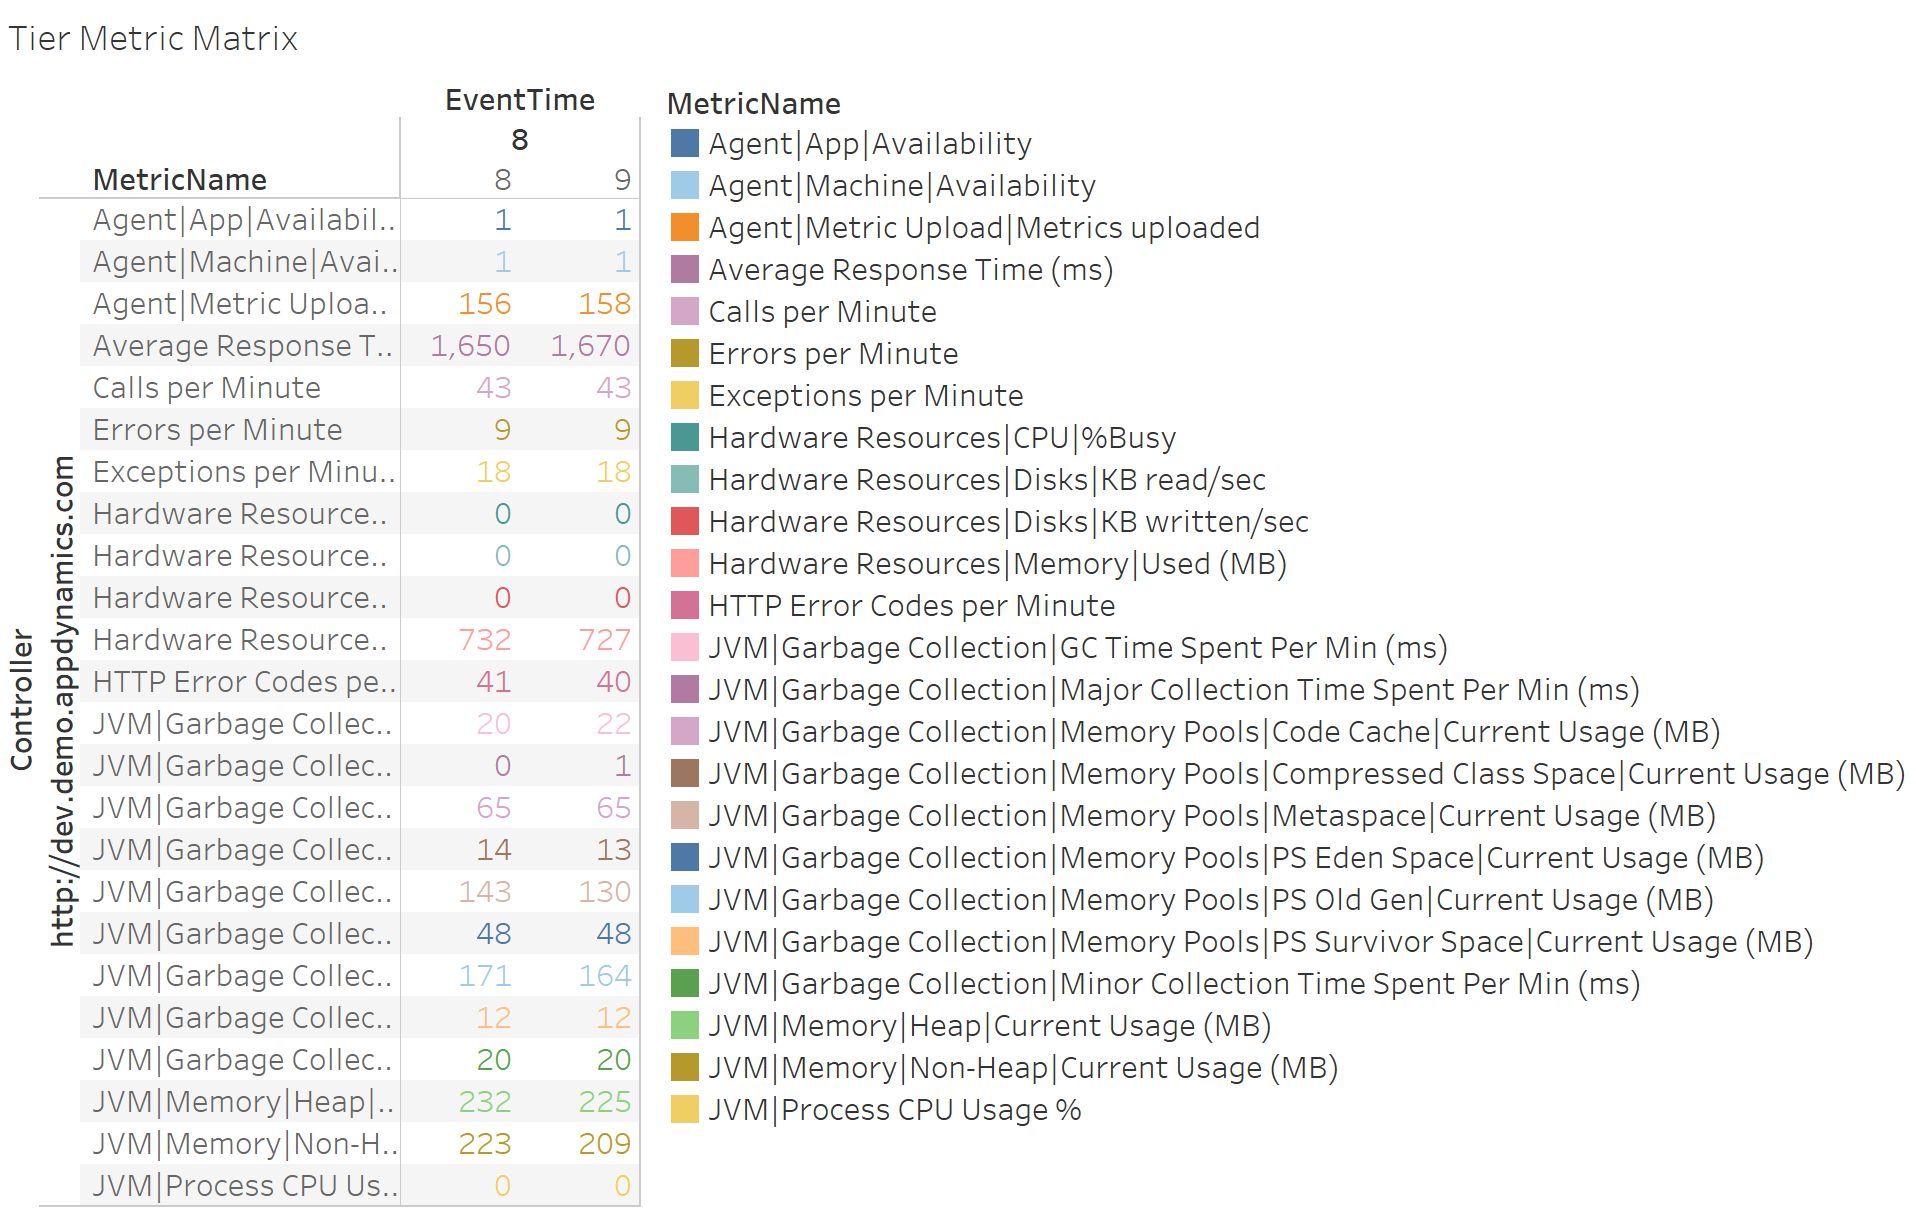
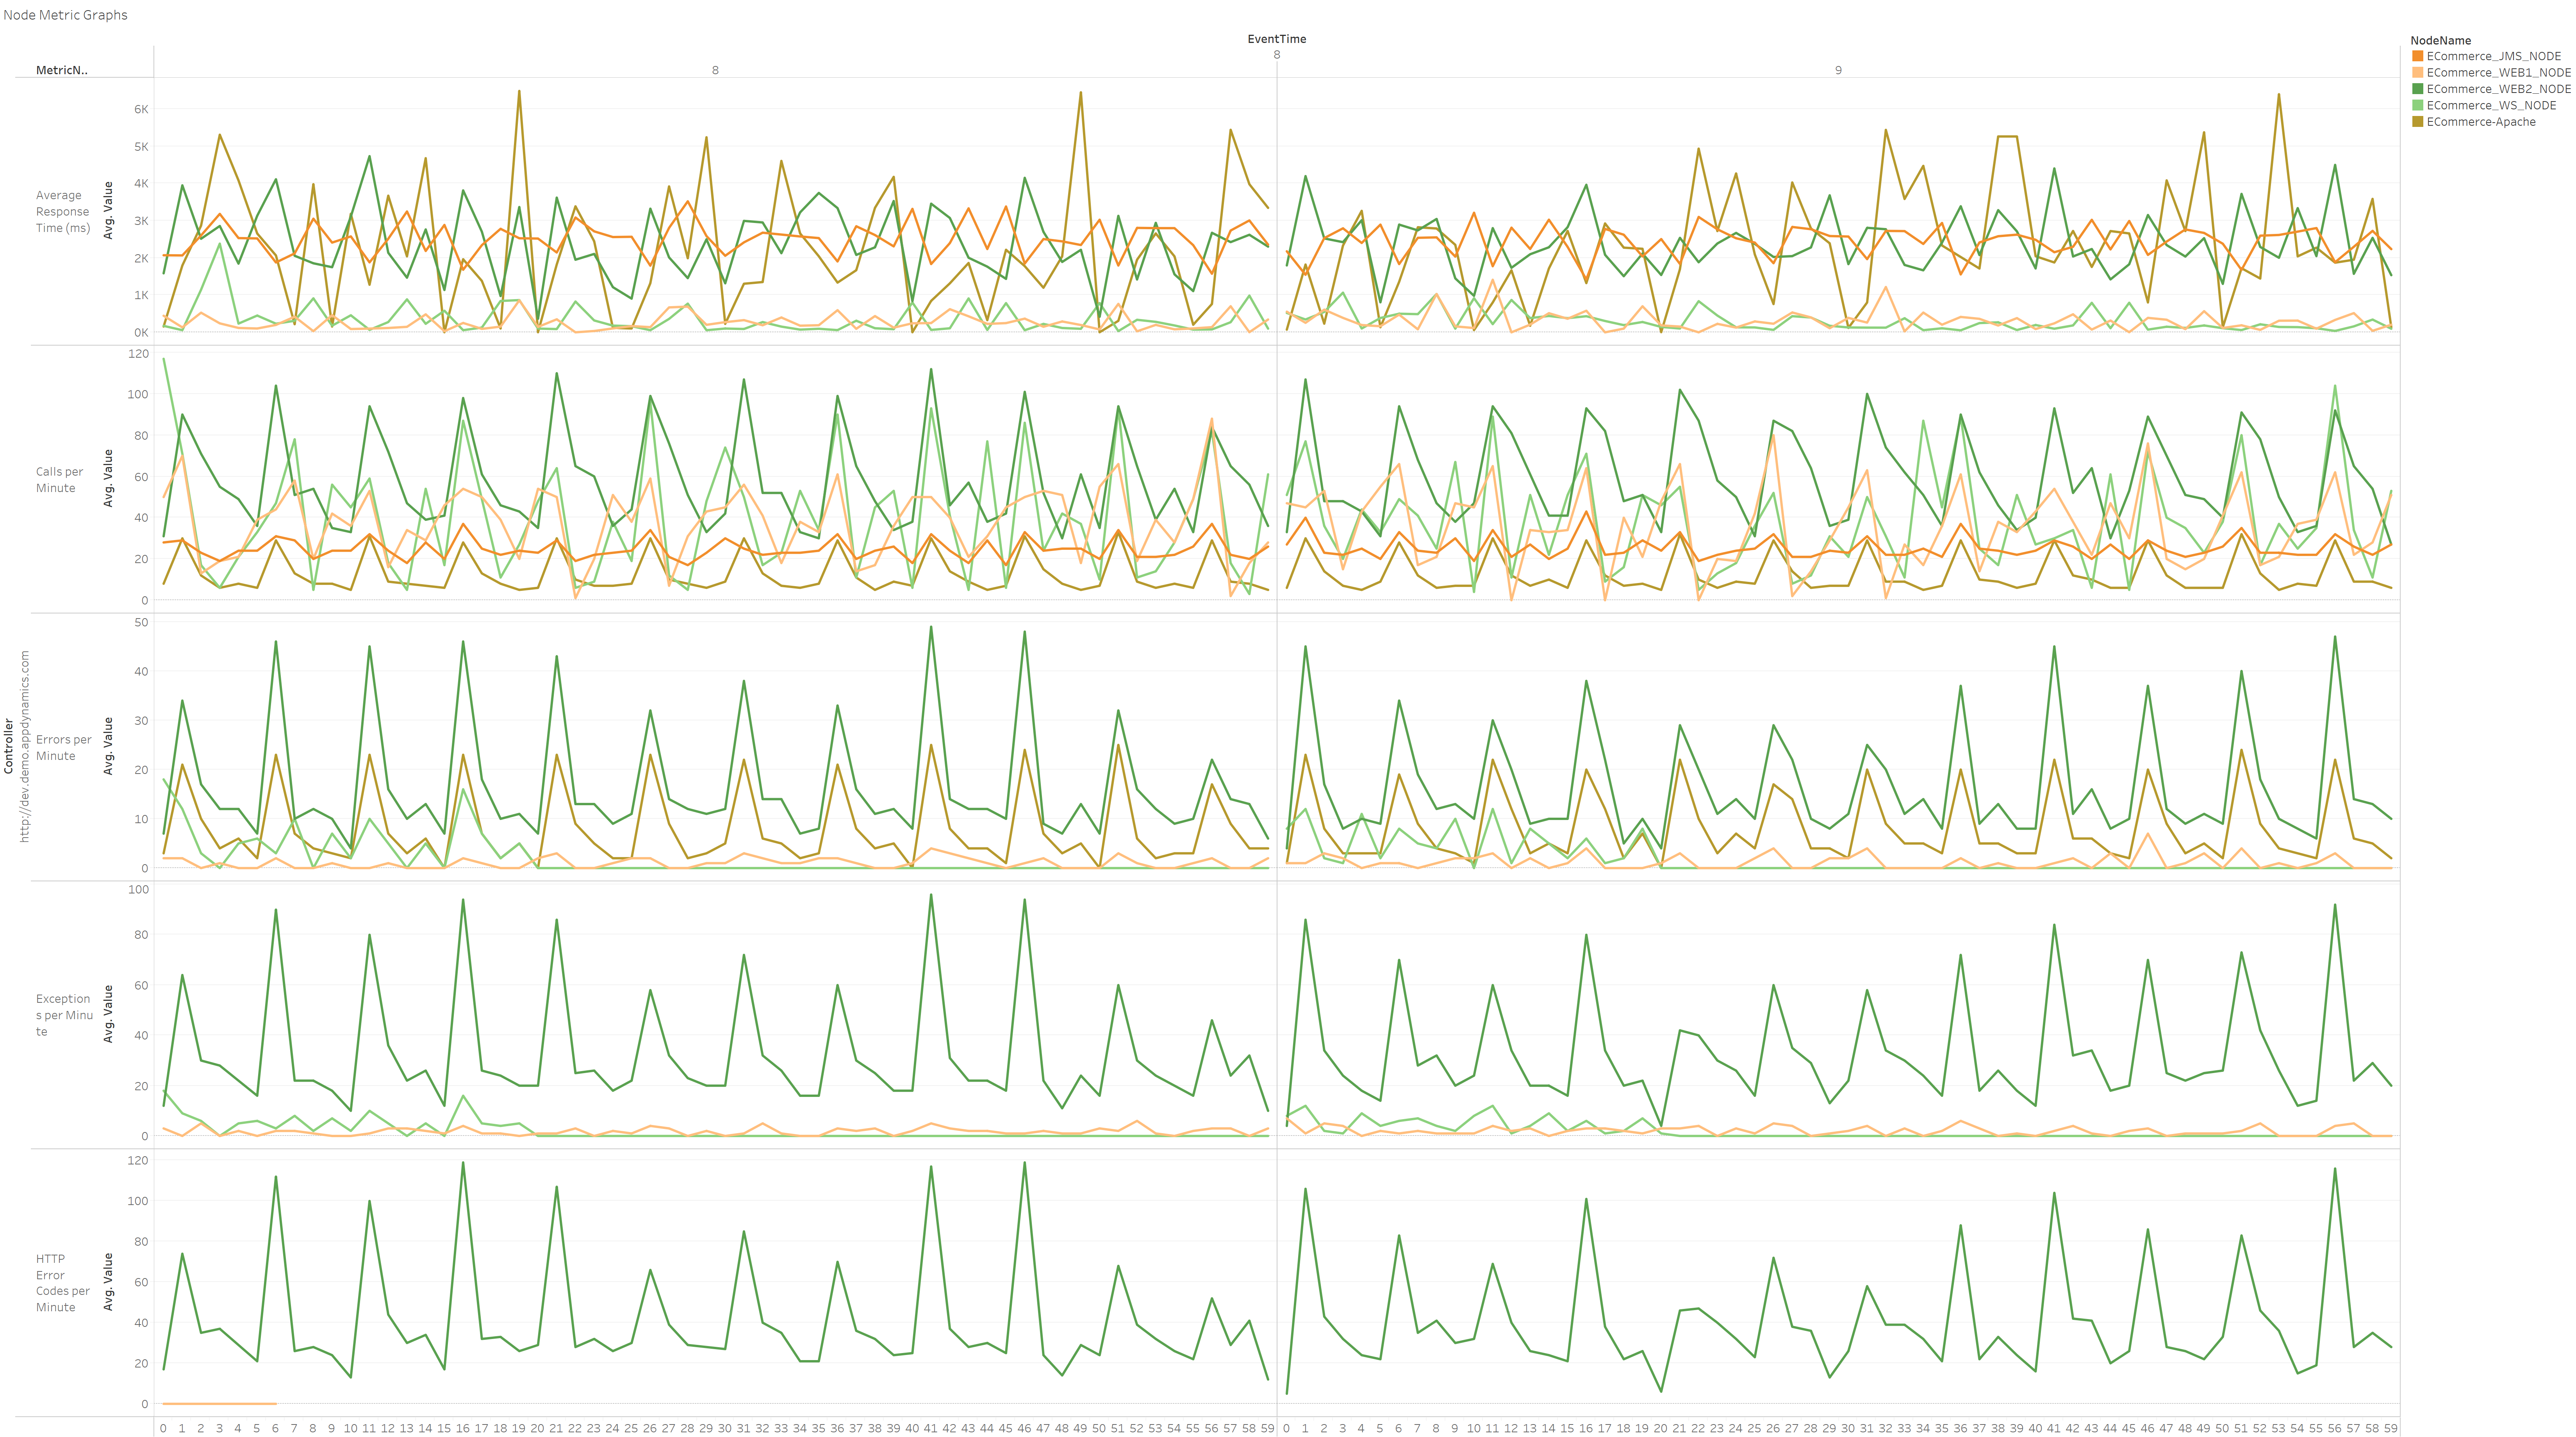
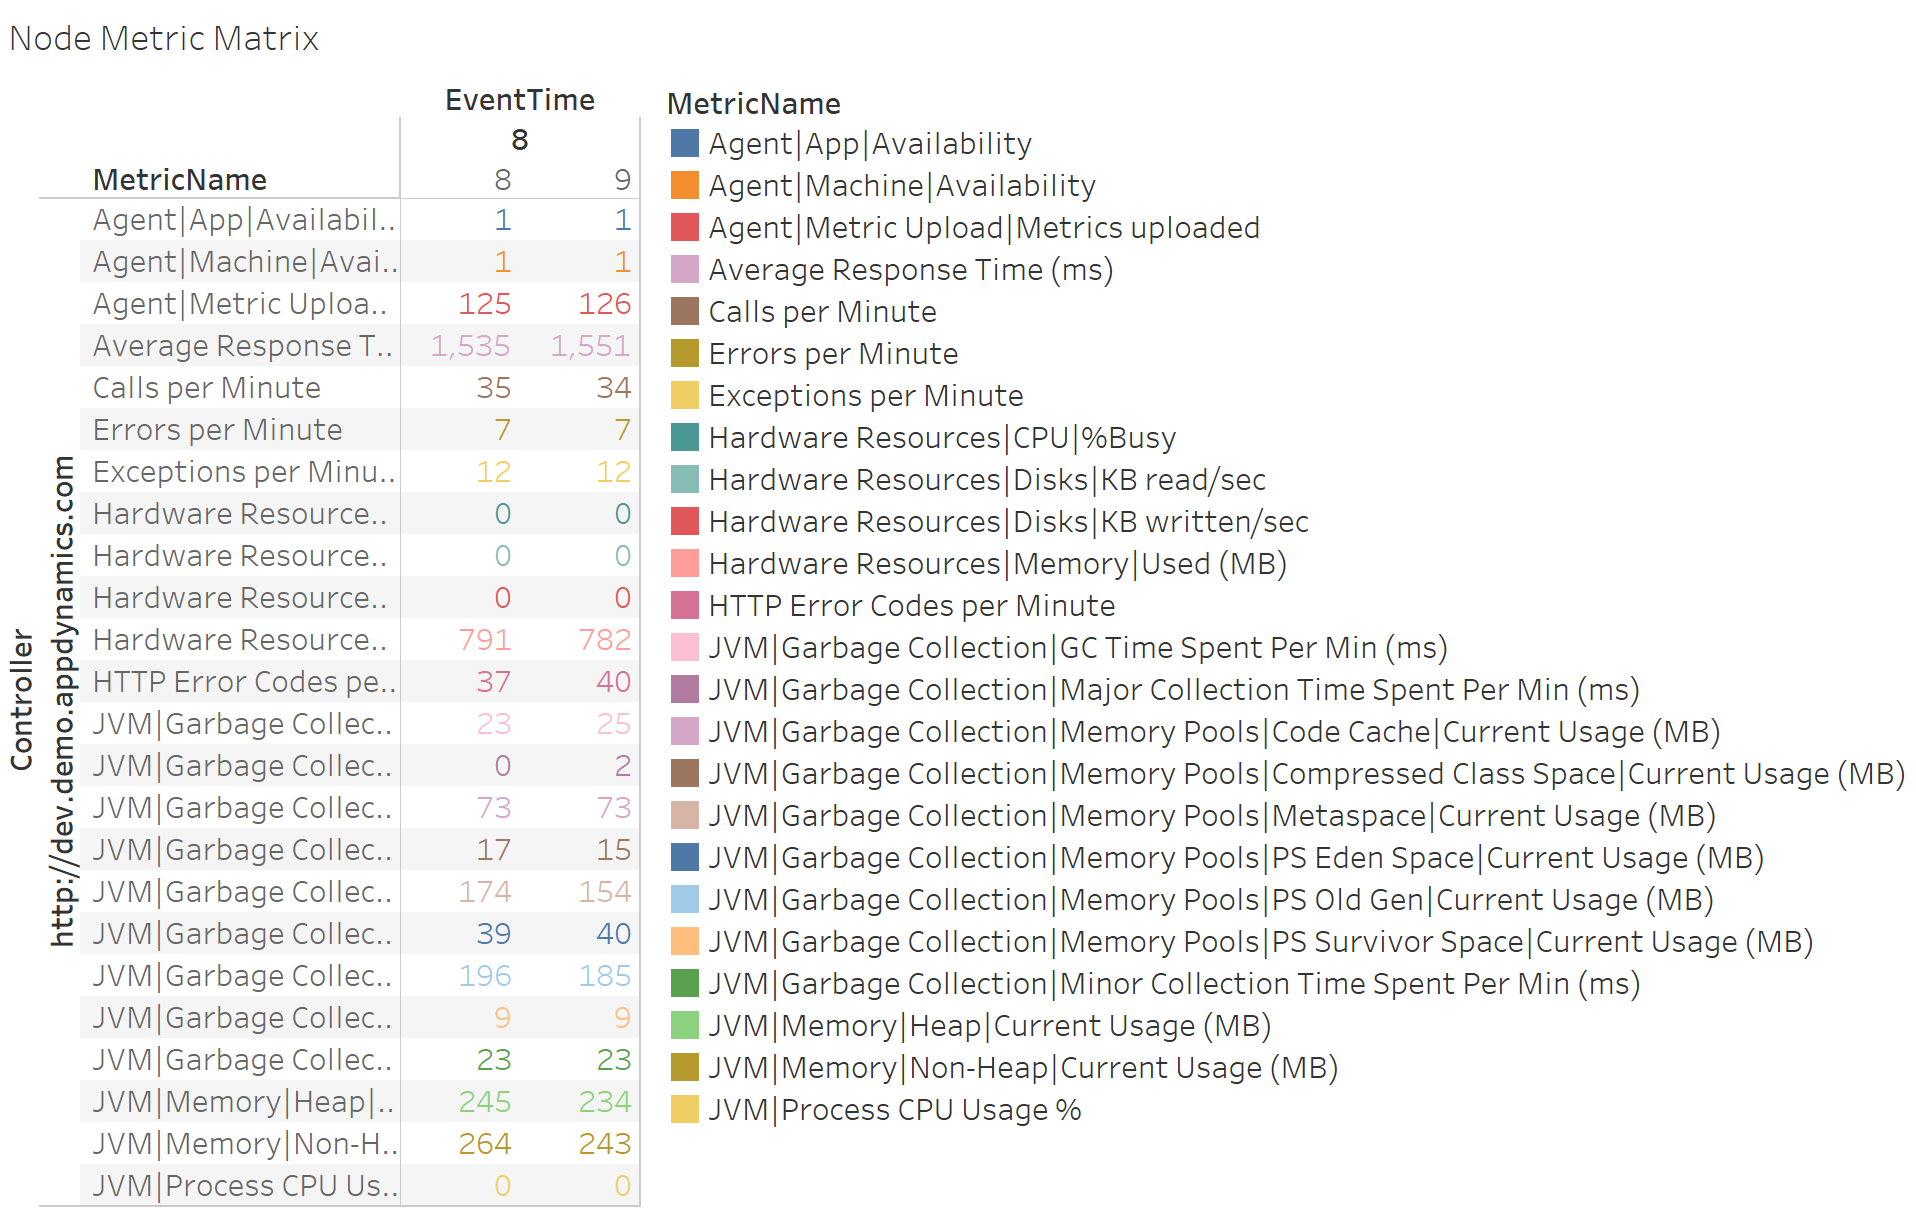
Entity Metrics report (EntityMetrics.twb) shows summary for all Metrics for all metrics for every detected Application, Tier, Node, Business Transaction, Backend, Service Endpoint, Errors and Information Point and individual time series for entire time range

This PowerBI report provides visual exploration tools for navigating the same data as Entity Metrics and Entity Metric Graphs reports.

Report Contents

Data Notes
Metrics 1 - App - Graph
Metrics 1 - App - Matrix
Metrics 2 - Tier - Graph
Metrics 2 - Tier - Matrix
Metrics 3 - Node - Graph
Metrics 3 - Node - Matrix
Metrics 4 - BT - Graph
Metrics 4 - BT - Matrix
Metrics 5 - Backend - Graph
Metrics 5 - Backend - Matrix

Metrics 1 - App - Graph

Report Image Full Size

Metrics 1 - App - Matrix

Report Image Full Size

Metrics 2 - Tier - Graph

Report Image Full Size

Metrics 2 - Tier - Matrix

Report Image Full Size

Metrics 3 - Node - Graph

Report Image Full Size

Metrics 3 - Node - Matrix

Report Image Full Size

Metrics 4 - BT - Graph

Report Image Full Size

Metrics 4 - BT - Matrix

Report Image Full Size

Metrics 5 - Backend - Graph

Report Image Full Size

Metrics 5 - Backend - Matrix

Report Image Full Size

Clone this wiki locally