Walkthrough Part 1
The AppDynamics interface is built upon the concept of "Applications" - logical groups for organizing individual executables (Nodes) into roles of execution (Tiers). All discovery in AppDynamics is scoped to the Applications. If your app spans multiple AppD Applications, or if you have multiple instances of your application serving, say, multiple customers or data centers, or if you’re using blue-green deployment, etc., you must manage those environments individually.
Sometimes reviewing information in aggregate can be easier than tracking individual snapshots. AppDynamics is often configured to focus on data relevant to the immediate past - aggregating older data to provide more trend-based information rather than keeping everything for extended time periods. But when you want to perform more detailed, long-term analysis of a particular time range, DEXTER can help with that capture.
If you’re familiar with data warehousing terminology, think of DEXTER as an extract/transform/load (ETL) utility for AppDynamics data. It extracts information from the AppDynamics platform, transforms it into an enriched, query-able form for faster access, and loads it into variety of reports for:
- Application logical model (applications, tiers, nodes, backends, business transactions)
- Performance metrics (average response time, calls, errors per minute, CPU, memory, JVM, JMX, GC metrics)
- Dependency data (flow maps, relationships between components)
- Events (errors, resource pool exhaustion, application crashes and restarts, health rule violations)
- Configuration rules (business transaction, backend detection, data collectors, error detection, agent properties)
- Snapshots (SQL queries, HTTP destinations, data collectors, call graph data, errors)
The data, once extracted, is yours to mine. DEXTER provides Microsoft Excel and Power BI templates for viewing and analyzing your data.
Should you have additional data-mining needs, DEXTER provides clean, well-formatted CSV files for use in other data warehousing and enhanced query systems, such as Tableau and Power BI.
One common scenario is to identify the time of interest - say, a load test, an application outage, or a reported customer bug - and preserve this data for careful analysis and/or future comparison against a similar incident.
To give DEXTER instructions on what to report, first create a job parameter file in simple JSON format. In the example below, we specify that we want all AppDynamics APM Applications data from two Controllers in a two-hour time range, and instruct DEXTER to extract and report on the logical model, configuration rules, performance metrics, dependency data, events, and snapshots:
{
    "Input": {
        "TimeRange": {
            "From": "2018-01-31T19:00:00",
            "To": "2018-01-31T21:00:00"
        },
        "Metrics": true,
        "MetricsSelectionCriteria": ["Transaction", "AgentStats", "OSHardware", "CLRStats", "IISStats", "JVMStats", "BusinessTransactionPercentiles"],
        "Flowmaps": true,
        "Configuration": true,
        "Events": true,
        "Snapshots": true,
        "SnapshotSelectionCriteria": {
            "Tiers": [],
            "TierType": {
                "All": true,
                "APP_AGENT": false, "DOT_NET_APP_AGENT": false, "NATIVE_APP_AGENT": false, "NATIVE_DYNAMIC": false, "NATIVE_SDK": false,
                "NATIVE_WEB_SERVER": false, "NODEJS_APP_AGENT": false, "PHP_APP_AGENT": false, "PYTHON_APP_AGENT": false, "RUBY_APP_AGENT": false
            },
            "BusinessTransactions": [],
            "BusinessTransactionType": {
                "All": true,
                "SERVLET": false, "HTTP": false, "WEB_SERVICE": false, "POJO": false, "JMS": false, "EJB": false, "SPRING_BEAN": false, "STRUTS_ACTION": false, "ASP_DOTNET": false, "ASP_DOTNET_WEB_SERVICE": false, "DOTNET_REMOTING": false, "WCF": false, "DOTNET_JMS": false, "POCO": false,
                "PHP_WEB": false, "PHP_MVC": false, "PHP_DRUPAL": false, "PHP_WORDPRESS": false, "PHP_CLI": false, "PHP_WEB_SERVICE": false, "NODEJS_WEB": false, "NATIVE": false, "WEB": false, "PYTHON_WEB": false, "RUBY_WEB": false, "RUBY_RAILS": false, "BINARY_REMOTING": false
            },
            "UserExperience": {
                "Normal": true,
                "Slow": true,
                "VerySlow": true,
                "Stall": true,
                "Error": true},
            "SnapshotType": {
                "Full": true,
                "Partial": true,
                "None": true
            }
        }
    },
    "Output": {
        "DetectedEntities": true,
        "EntityMetrics": true,
        "EntityMetricGraphs": true,
        "EntityDetails": true,
        "Events": true,
        "Configuration": true,
        "Snapshots": true,
        "FlameGraphs": true
    },
    "Target": [
        {
            "Controller": "http://demo1.appdynamics.com/",
            "UserName": "username@customer1",
            "UserPassword": "",
            "Application": ".*",
            "NameRegex": true
        },
        {
            "Controller": "http://demo2.appdynamics.com/",
            "UserName": "username@customer1",
            "UserPassword": "",
            "Application": ".*",
            "NameRegex": true
        }
    ]
}
After DEXTER runs, the reports are available in the user-selected Reports subfolder:

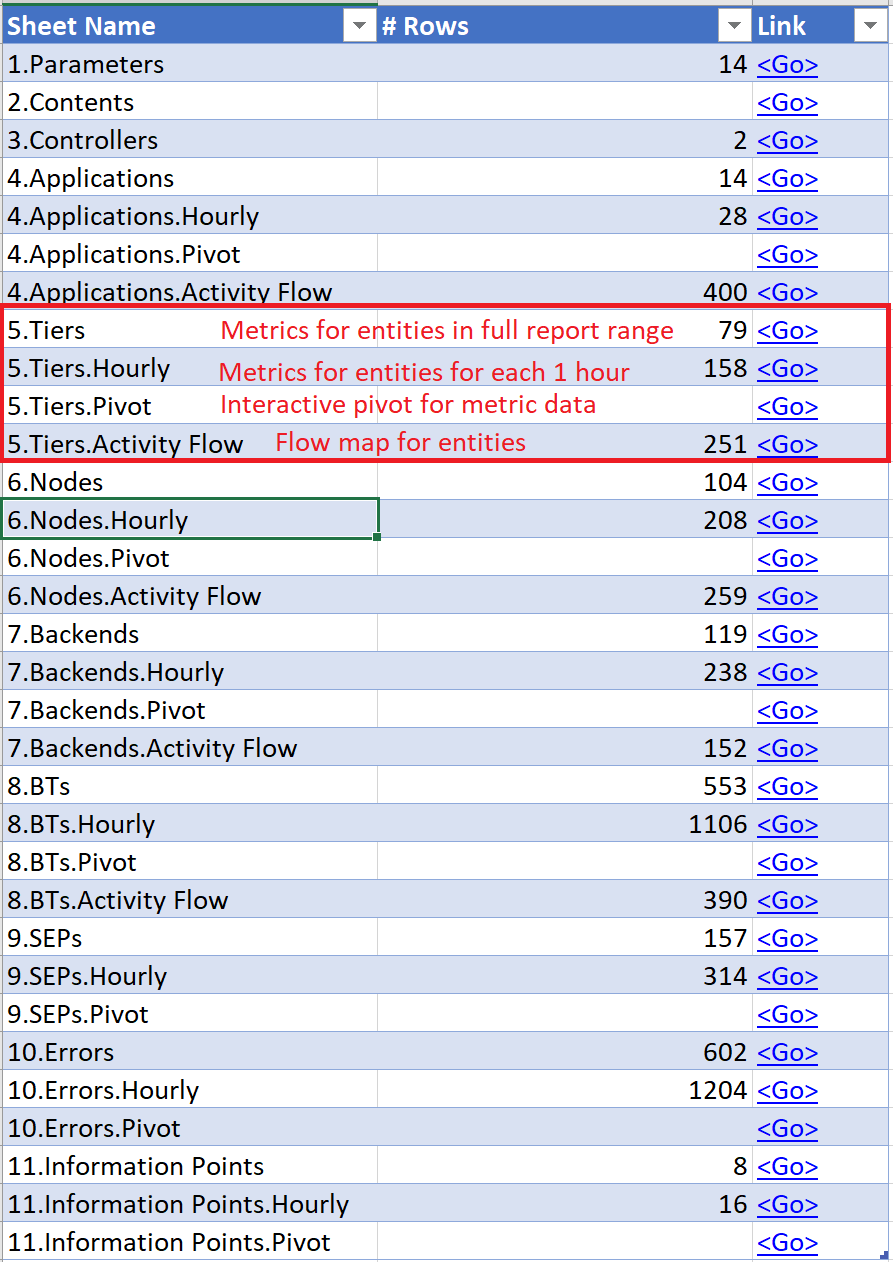
The Detected Entities report (Report\DetectedEntities.<Job File Name>.<Start Date and Time in yyyyMMddHHmm>.<Number Of Hours Spanned By Report>.xlsx) lets you rapidly review the logical model of as many AppDynamics Applications as you want. It helps identify areas to improve involving agent versions, Business Transaction management with rules, and Backend detection.
Opening up the Detected Entities report, we are presented with series of sheets, each linked to the 2.Contents sheet. The report (below) shows the full logical model of AppDynamics’ APM model: Applications that contain Tiers, Nodes that report to Tiers, detected Backends, Business Transactions (both automatically detected and configured explicitly), detected errors, and so on.

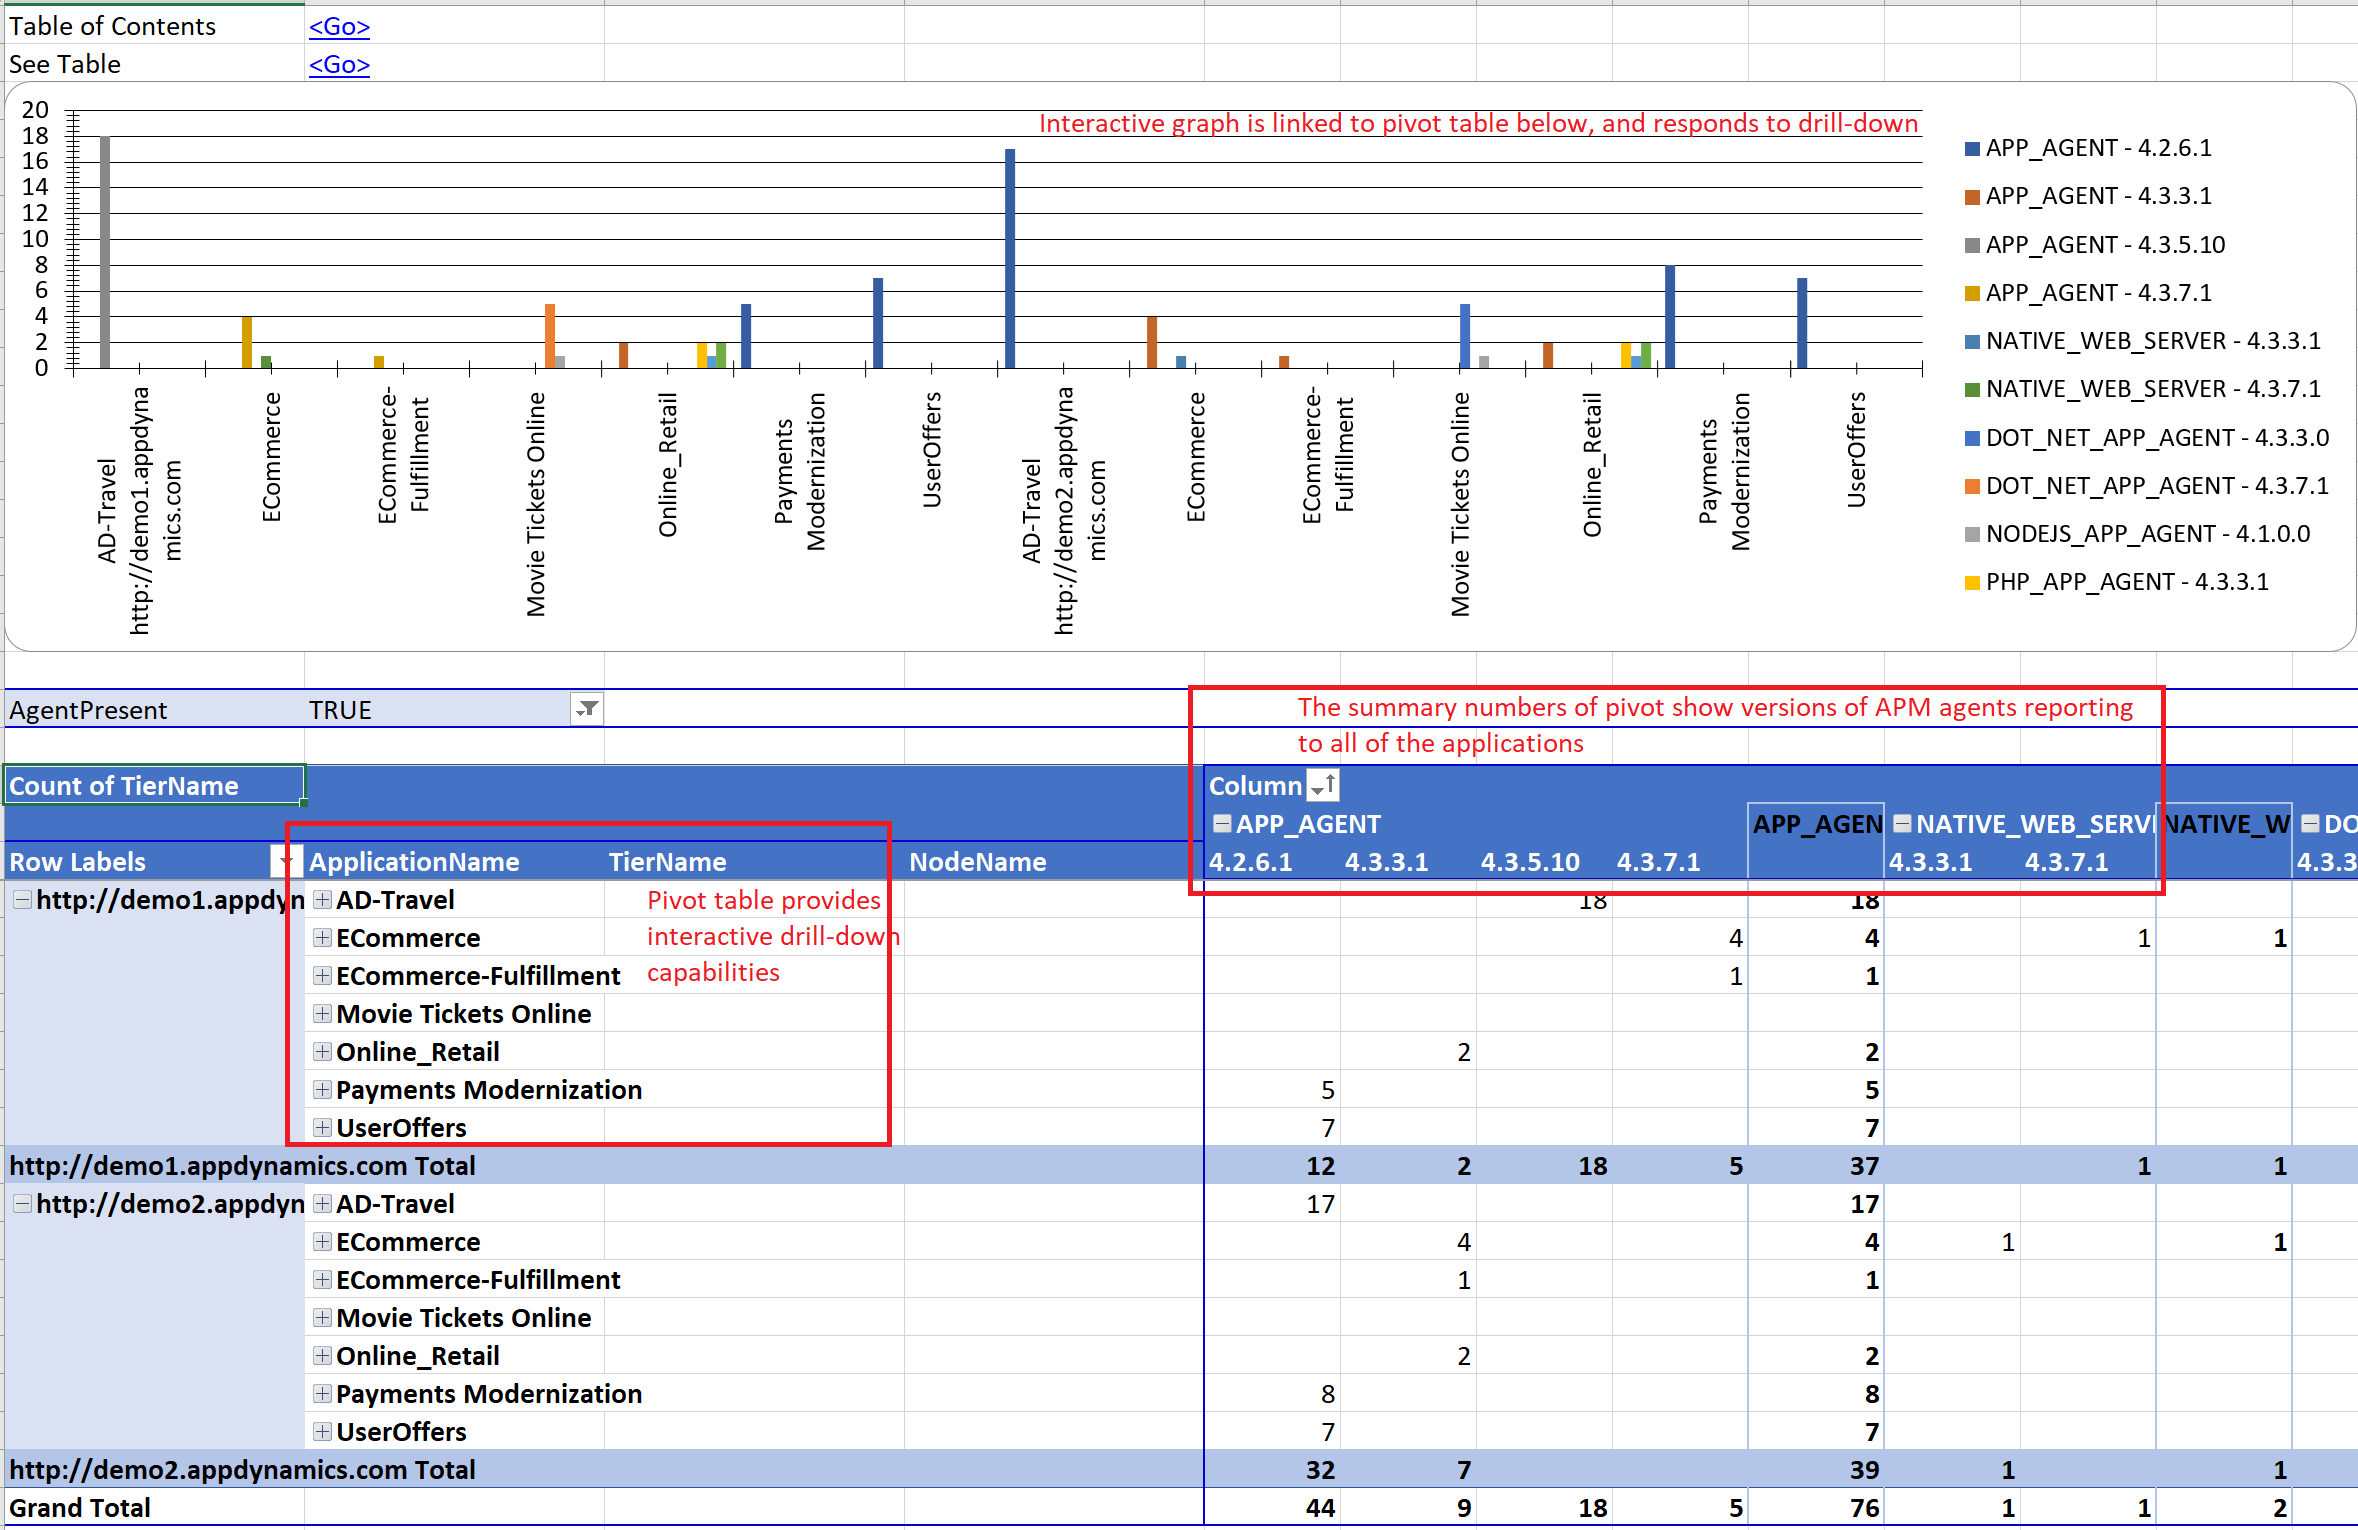
Jumping to the 6.Nodes.Type.AppAgent sheet, we use an Excel PivotTable and its associated bar chart to explore APM agent information from the table in 6.Nodes sheet. Here we can see that a couple of Applications are still running on AppDynamics version 4.2 and should probably be upgraded. Although the data came from two different Controllers, our report spans them both:
Using the 8.BTs.Type sheet, we discover and compare the configuration of Business Transactions across multiple Applications. In this environment, each of the two Controllers has an ECommerce Application that monitors the same app in two distinct environments. The resulting configuration should be the same; however, the report shows more Business Transactions of WEB_SERVICE in one Controller (demo2):

To find out which transactions are different, we can either use the PivotTable above or switch to the 8.BTs.Location sheet below, which uses the same data table from 8.BTs sheet but reorients the query to discovery summary data by different criteria. By adding a couple of filters, we see the Business Transaction count in the Total column. Excel’s Pivot Table Drilldown feature allows us to see exactly which tier the Business Transaction is registered to:

Now that we’ve identified configuration differences, we can decide if the differences are worth fixing and, if yes, apply relevant rules to create the desired configuration.
Let’s take a look at the core performance data that DEXTER has on the Applications’ logical entities.
The Entity Metrics report (Report\EntityMetrics.<Job File Name>.<Start Date and Time in yyyyMMddHHmm>.<Number Of Hours Spanned By Report>.xlsx) provides a linked table of contents for fast access to all components of the AppDynamics APM logical model. When generating this report, we requested two hours’ worth of data. For each of the entities - Application, Tier, Node, Business Transactions, and so on - the Entity Metrics report provides:
- Average Response Time (ART), Calls per Minute (CPM) and Errors per Minute (EPM) for the entire time range.
- ART, CPM and EPM for each hour in the time range (here we have two hours).
- A flow map of the time range.
Now let’s compare the performance of the ECommerce application tiers across two environments, as reported from two different Controllers. Using the 5.Tiers.Hourly sheet, we filter to the desired application (ApplicationName=ECommerce), including only active tiers (HasActivity=TRUE) and the first hour of the exported range (From=01/31/2018 19:00:00). The ART/CPM scatterplot above the detailed table shows us that the transaction characteristics of ECommerce Applications are largely identical, except for the ECommerce-Services Tier, which is 200ms faster in demo1 than demo2 Controllers:

By opening the Entity Metric Graphs report (Report<Controller><Application>\EntityMetricGraphs....-.xlsx) for demo2, and switching to the 5.Tiers.Graphs sheet, we see one-minute metric data for each of the two time ranges that we exported. We also see that Average Response Time (green) seems to spike up at the start of each hour for 15 to 18 minutes. We’ll dig into this deeper shortly.
A different view into these hourly ranges is provided by the 5.Tiers.Scatter sheet, which shows a scatter plot graphing Average Response Time against Calls per Minute (blue dots) and Errors per Minute (red dots). This is a more compact representation of the time series from the previous chart. On the ECommerce-Services tier, we see a grouping of calls at a higher CPM rate, indicating occasional traffic spikes. On the Inventory-Services tier, we see that most calls fall into fast ART territory, except for some in very slow areas.
The transaction performance data is provided for every entity type by the AppDynamics APM logical model.
In addition, DEXTER exports and graphs core CPU, Memory, Network, Disk, JVM, JMX, CLR and Garbage Collection metrics for individual Nodes and Tiers. Finally, DEXTER allows you to add any custom metrics (such as custom JMX for Java, PerfMon for .NET, or metrics from custom extensions from the AppDynamics extension marketplace) to the list of exported and archived data. In this example, we have three different JVMs with their Garbage Collection information preserved for analysis:
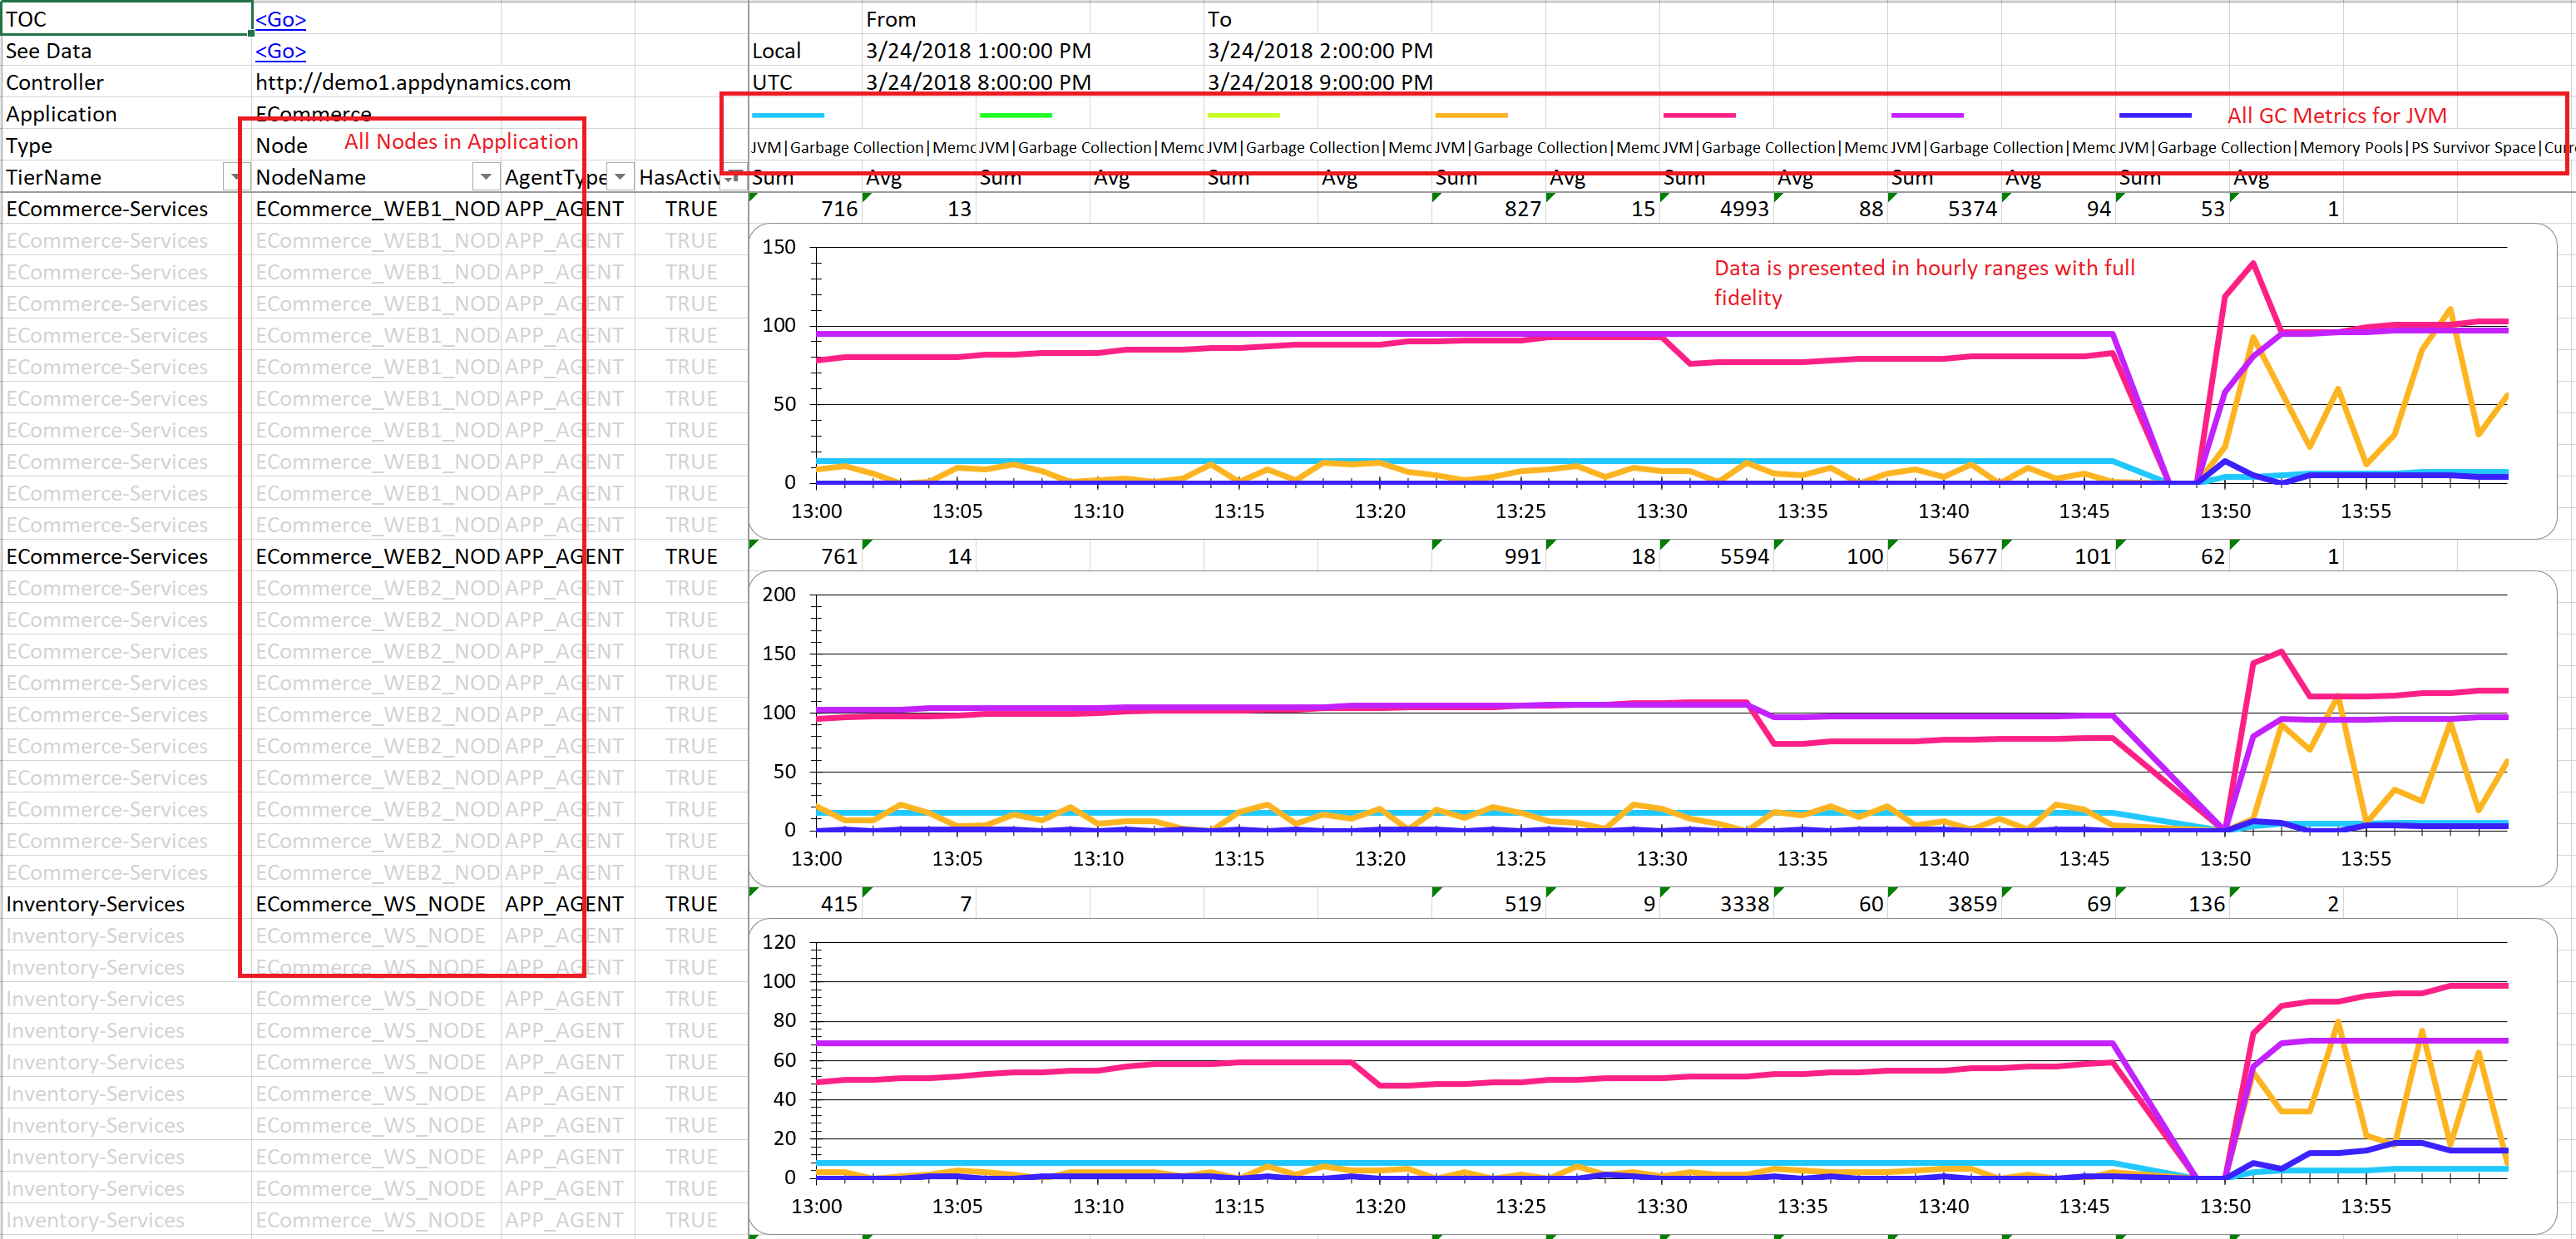
The AppDynamics Controller will roll up this detail by default, but DEXTER provides an option for preserving this data offline for future analysis.
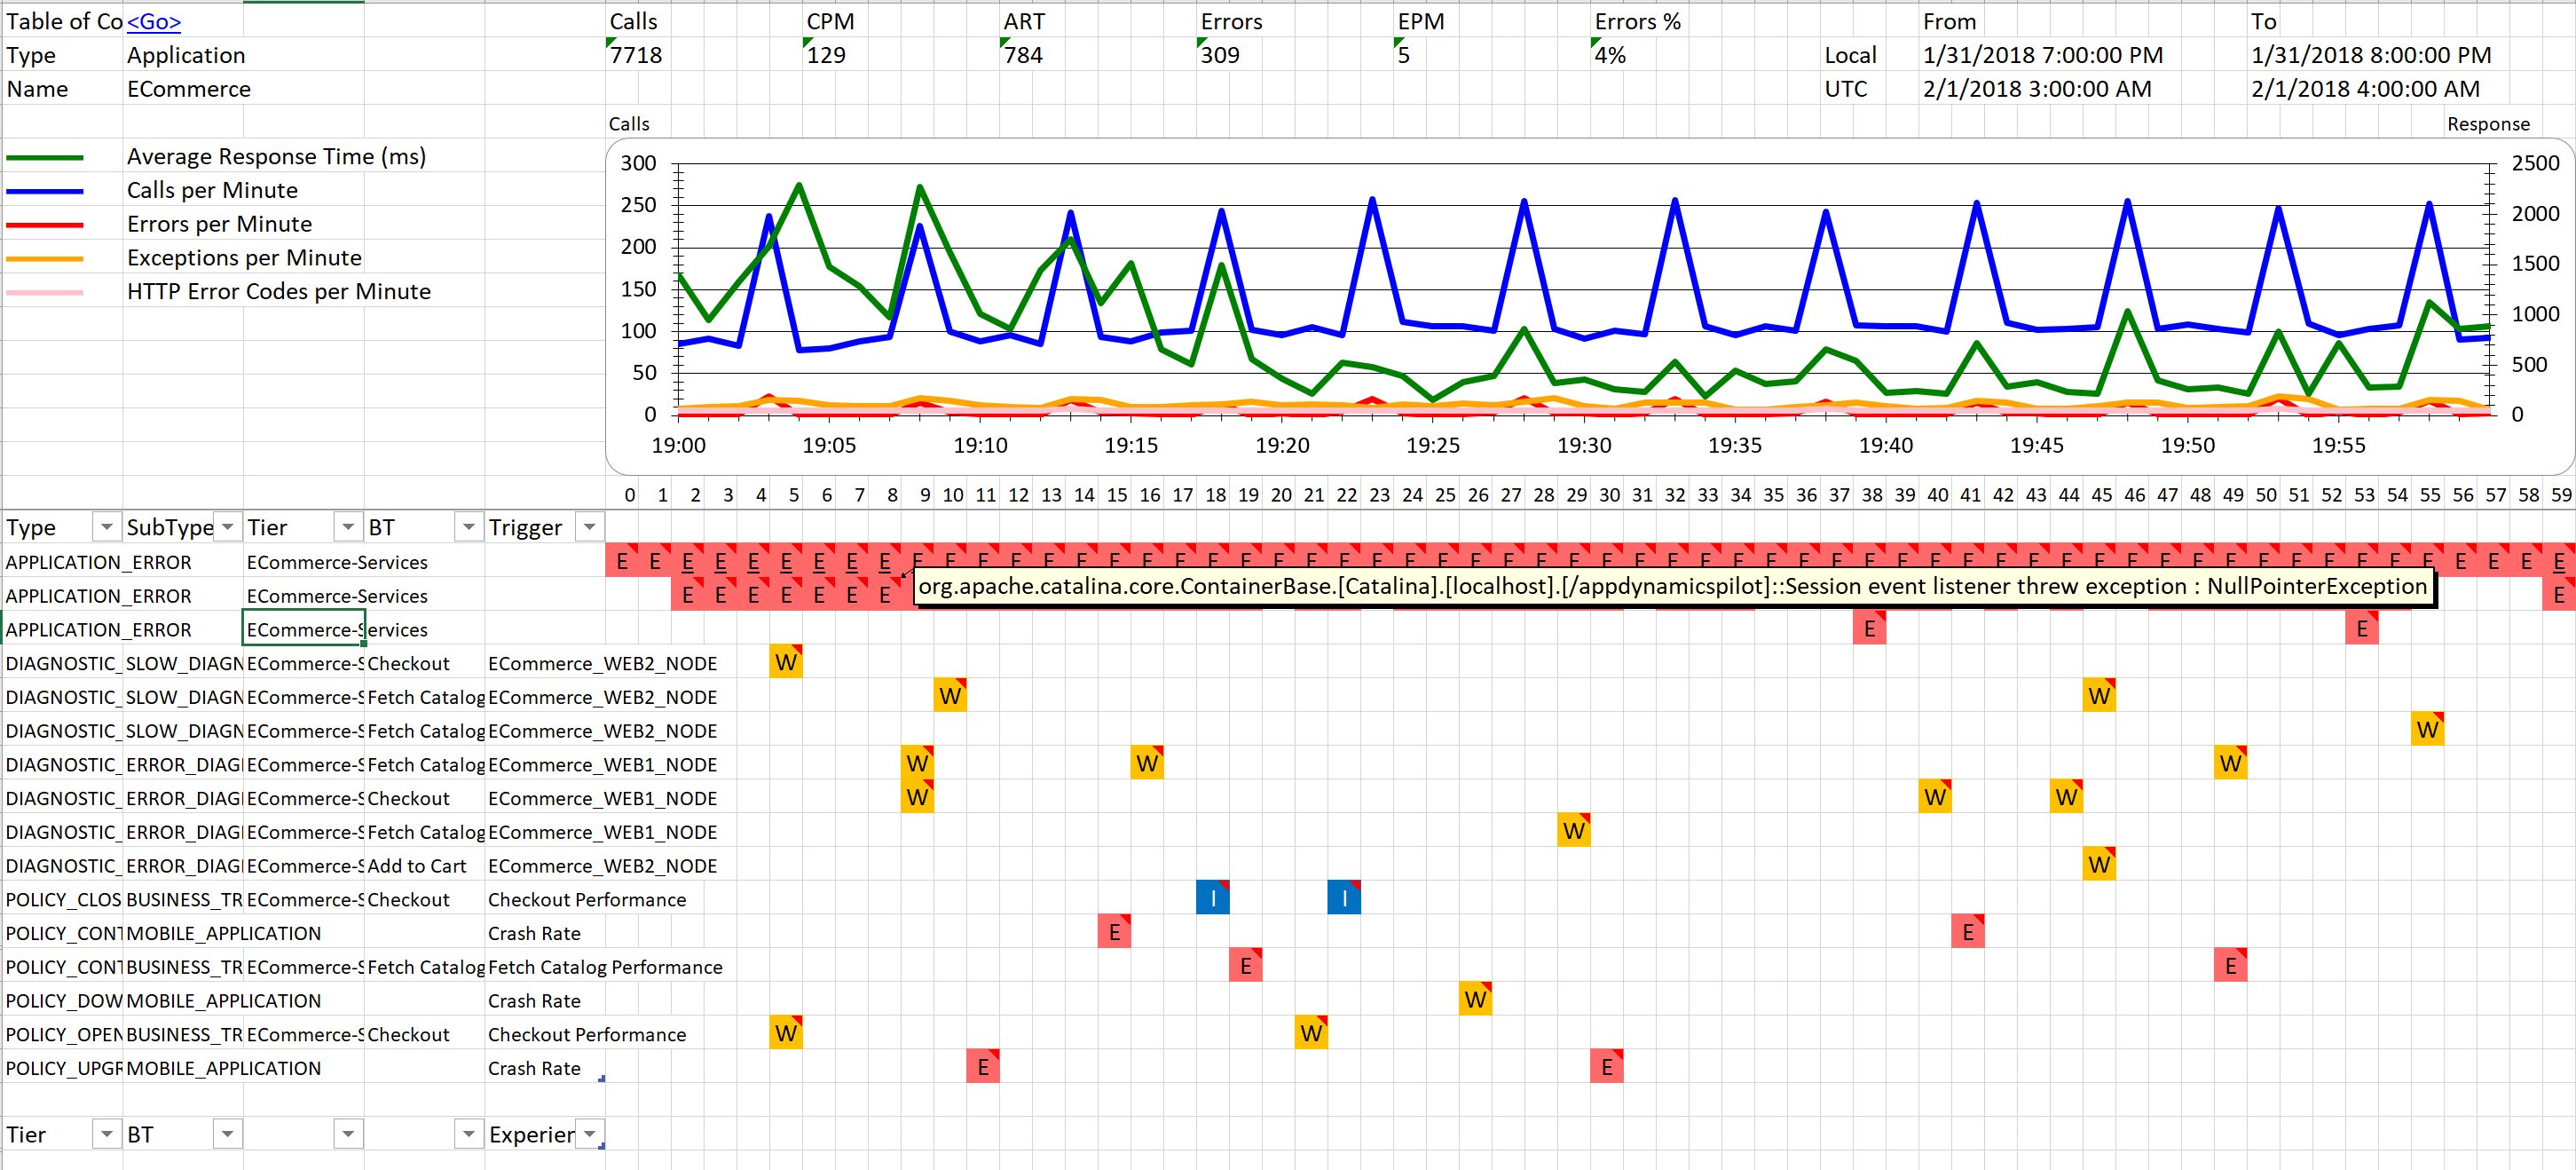
Now let’s take a look at activity in the ECommerce application in our requested time range. The Entity Details report combines Metric graph data with a timeline overlay of Events and Snapshots. The Entity Details report is linked from the Detected Entities and Entity Metrics reports, and is stored in Report\<Controller>\<Application>\<APP|TIER|NODE|BT|BACK|ERR|SEP>\EntityDetails.<ControllerName>.<ApplicationName>.<EntityName>.<Start Date and Time>-<End Date and Time>.xlsx
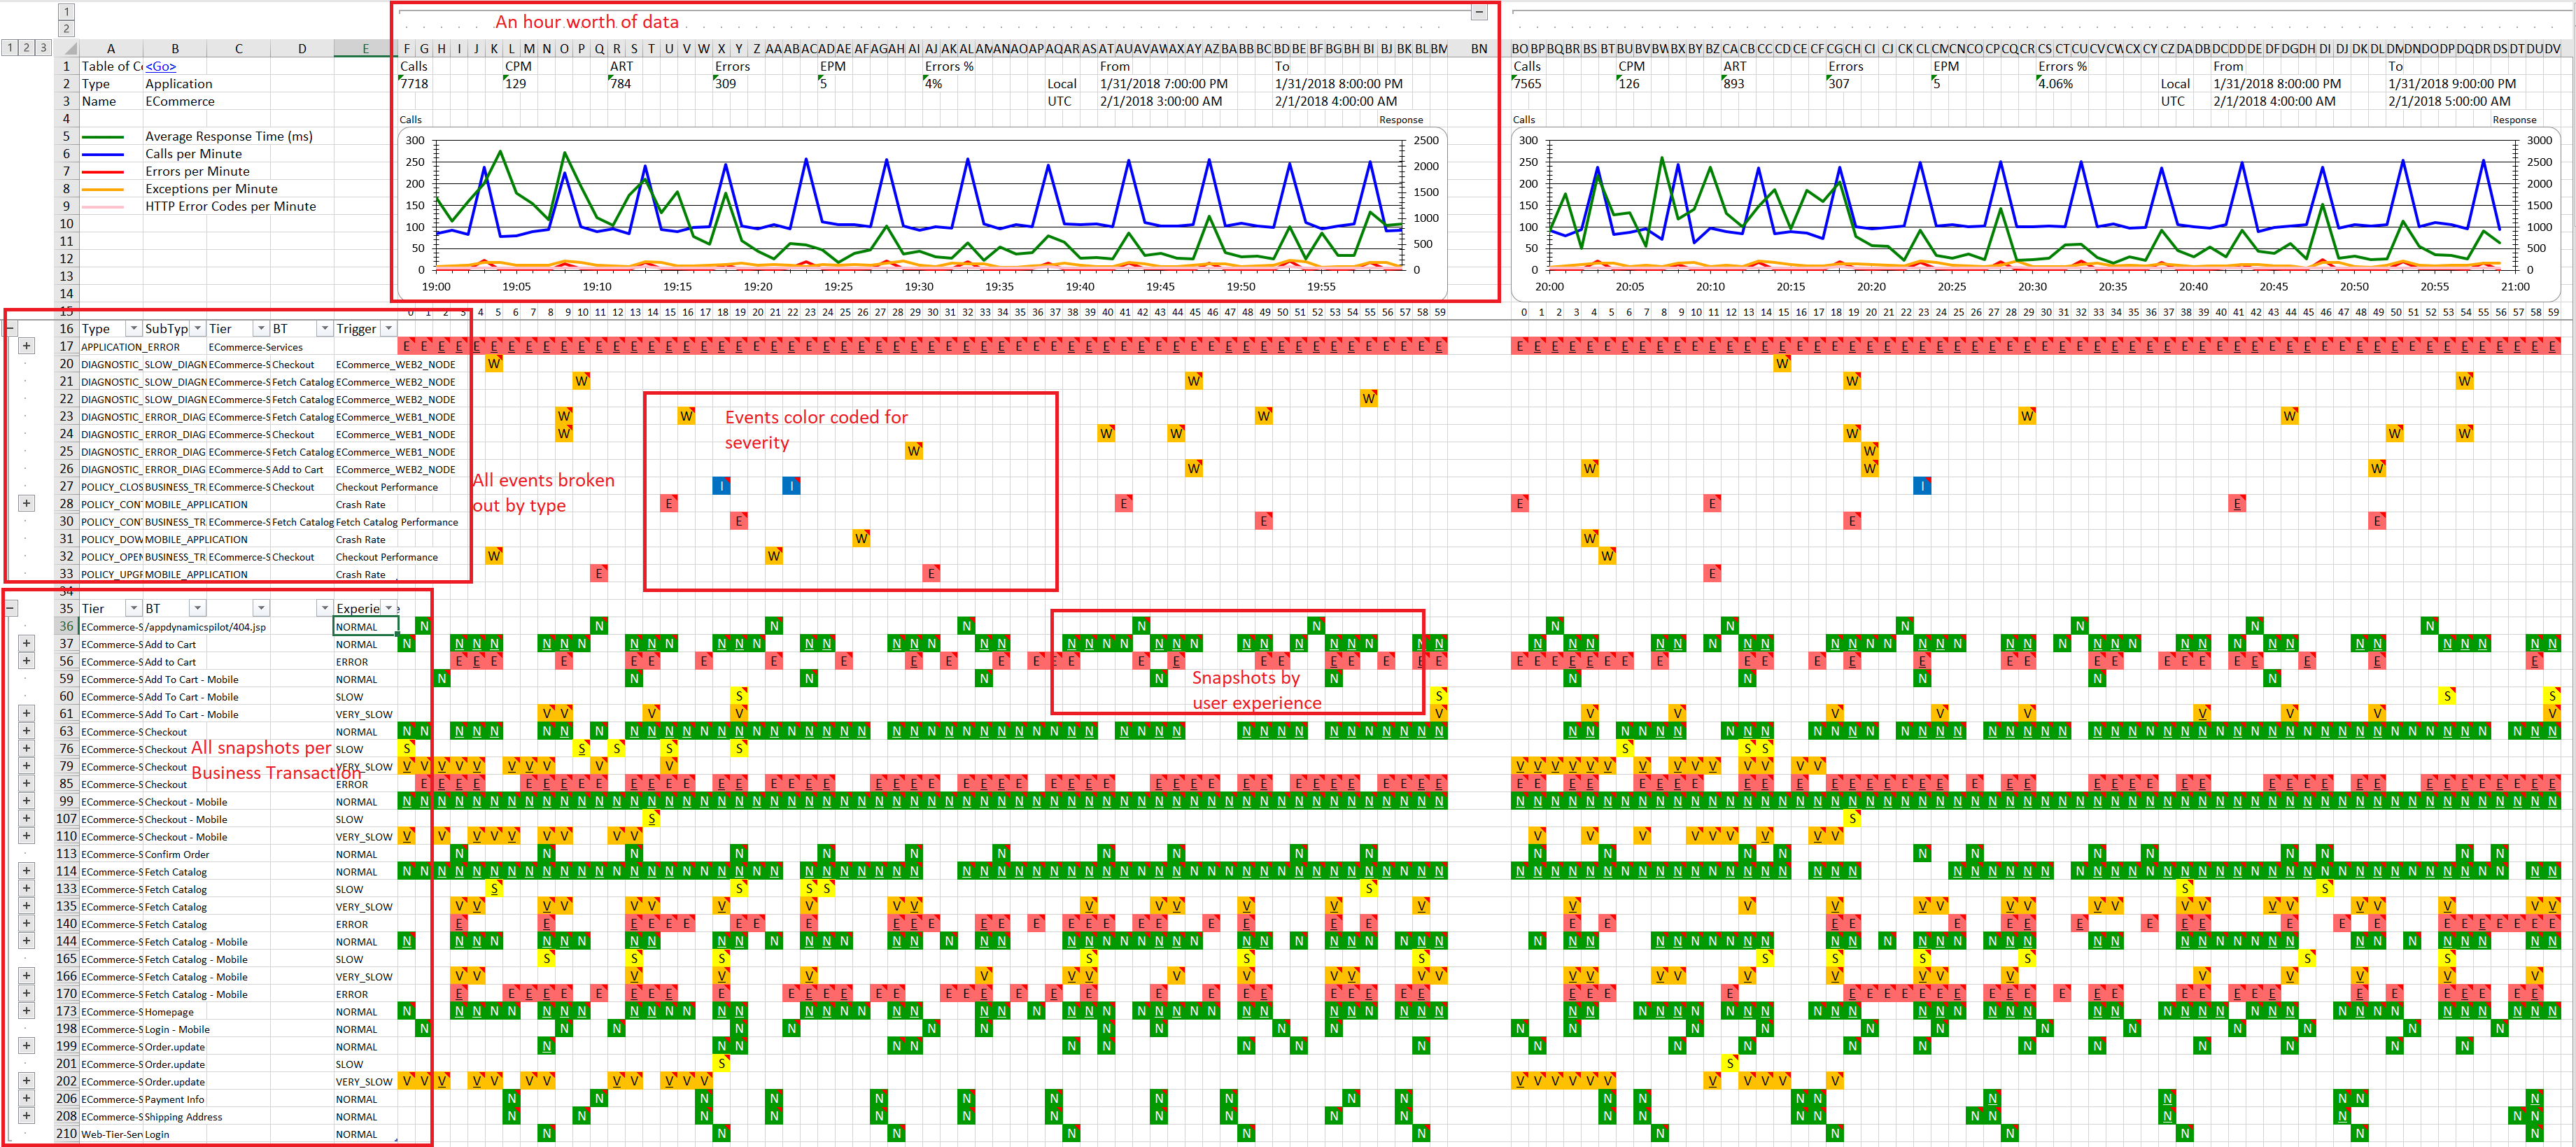
By switching to the 6.Timeline sheet, we’re able to view this fairly complex report:
Do not be alarmed. This will all make sense shortly!
Since we requested two hours’ worth of data, we now have two vertical sections for each hour, each exactly 60 cells wide, one for each minute. The one-minute resolution metrics are overlaid on top of the table of minutes in an hour. Events and Snapshots are displayed in two tables below the graphs. Events come first, showing Error, Warning and Informational incidents. By hovering the cursor over an event, you’ll see details in popup, allowing you to review patterns rapidly. If there’s more than one event per minute, the events are stacked vertically. In the example below, minute 38 has three APPLICATION_ERROR messages:
Now let’s investigate Application Snapshots by collapsing the Events table, and then filtering the Snapshots table to show only "Slow" and "Very Slow" user experiences.
Immediately, a visible pattern emerges of slow Snapshots associated with "Checkout" and "Checkout - Mobile" Business Transactions - two of the most important revenue-generating activities in our ECommerce application.
By hovering over one representative Snapshot, we see the delay is likely due to the slow execution of queries against an Oracle database backend. And by previewing other Snapshots in the same time range, we can confirm this pattern without having to open each Snapshot individually:

AppDynamics DEXTER provides the ability to unlock data stored in the AppDynamics APM platform and rapidly turn it into valuable insights. The clean data it produces can be used in data warehousing applications and - when combined with your own data - to create customized reports.
Return to Getting Started
Proceed to Walkthrough Part 2