-
Notifications
You must be signed in to change notification settings - Fork 6
MS MetFrag XCMS Workflow
To try the workflow, please download and unzip first this data set to your own machine (click on the download button to the upper right of your browser window). Once you have that data unzipped, please follow the video tutorial MetFrag MS Workflow from a fresh VRE deployment, which will explain how to use the different pieces of data on the workflow.
Metabolite identification in clinical studies is a crucial step when trying to understand e.g. the courses of a disease on the metabolomic level. The MetFrag workflow goes a first step into this direction as it annotates molecules from compound (metabolite) databases to MS/MS (tandem mass spectrometry) spectra. This annotation is based on the mapping of in silico generated fragments to the experimental spectra and scoring of these mappings based on different criteria.

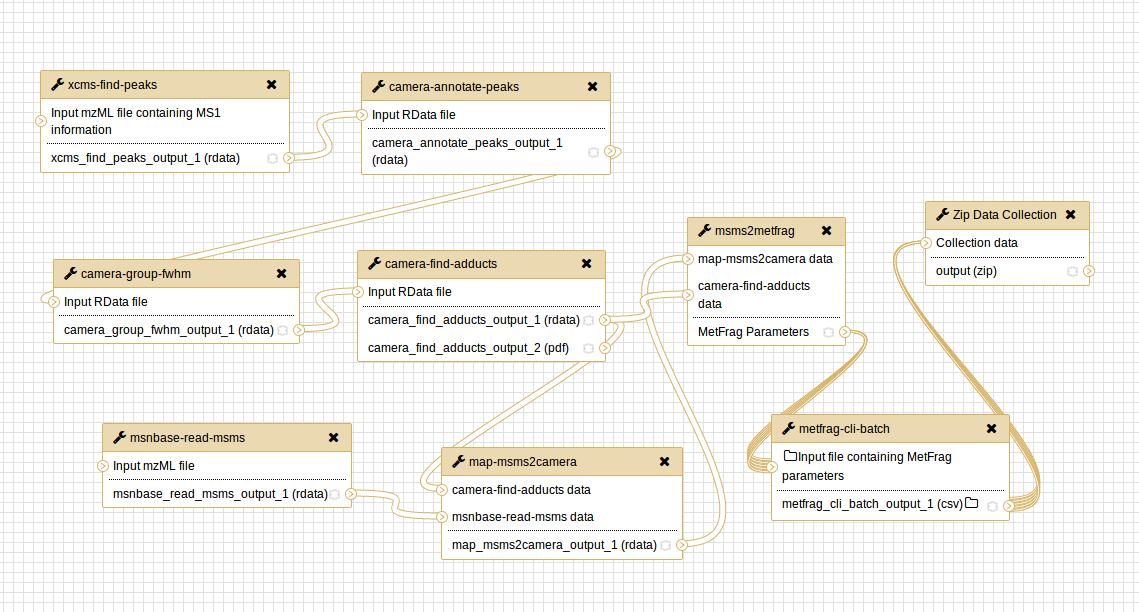
The workflow consists of different steps that include the pre-processing of the data using XCMS, MSnbase and CAMERA used to read the data from a given mzML file and to detect and annotate features. Given this annotation MetFrag parameter sets are generated that are passed to the MetFrag CLI Batch tool performing the actual processing that includes the annotation of molecular structures to the data. In the following the single steps will be described in detail.
The pre-processing starts with reading the peak information from a mzML file uploaded to the Galaxy history. This step on the one hand is performed by the module xcms-find-peaks and generates a rdata file storing a XCMS-Set object with the peak data consisting usually of retention time, mass-to-charge (m/z) ratio and intensity. On the other hand, the module ""msnbase-read-msms"" is used to retrieve the MS/MS spectra from a given mzML file. This can be a second mzML file apart from that used for the XCMS node or the same in case it contains both MS and MS/MS information.
Further steps could be applied e.g. peak grouping and retention time correction over serveral mzML files from different samples. As this workflow only aims in processing one mzML file from a single experiment these steps are not needed for the moment, whereas the modules are already available (xcms-group-peaks, xcms-correct-rt).
A second pre-processing step is performed by using CAMERA that groups peaks within a sample based on their retention time and intensity profile. Furthermore, the grouping regards information isotopologues and adducts, information that is usually acquired via mass spectrometry. The CAMERA annotation results in so called pseudo spectra where in the ideal each spectrum contains peaks from one single metabolite.
For the further MetFrag processing the adduct annotation step using camera-find-adducts is important as it is used to determine the monoisotopic masses of the precursor m/z features used to query molecules from compound databases.
As a last step of the pre-processing of the data, MetFrag parameter sets are generated from the given data by the module msms2metfrag. This includes the MS/MS peak list, information about the precursor (m/z, adduct type, charge) and database information (source, mass deviations).
Prior to creating parameter sets data from MS and MS/MS need to be joined together which is performed by map-msms2camera which aligns a given MS feature with its corresponding MS/MS peak list based on the retention time and m/z value. For each MS - MS/MS feature pair a parameter set is generated.
Each parameter set is processed individually by the metfrag-cli-batch module launching a single container instance in background for each input so that the MS/MS peak lists will be processed in parallel. This also means that for each parameter set a single result file is generated containing matching molecular candidates ranked by their MetFrag score. The candidates are queried given the database parameters previously set using the msms2metfrag module. Currently, PubChem, KEGG and MetChem (a local database).
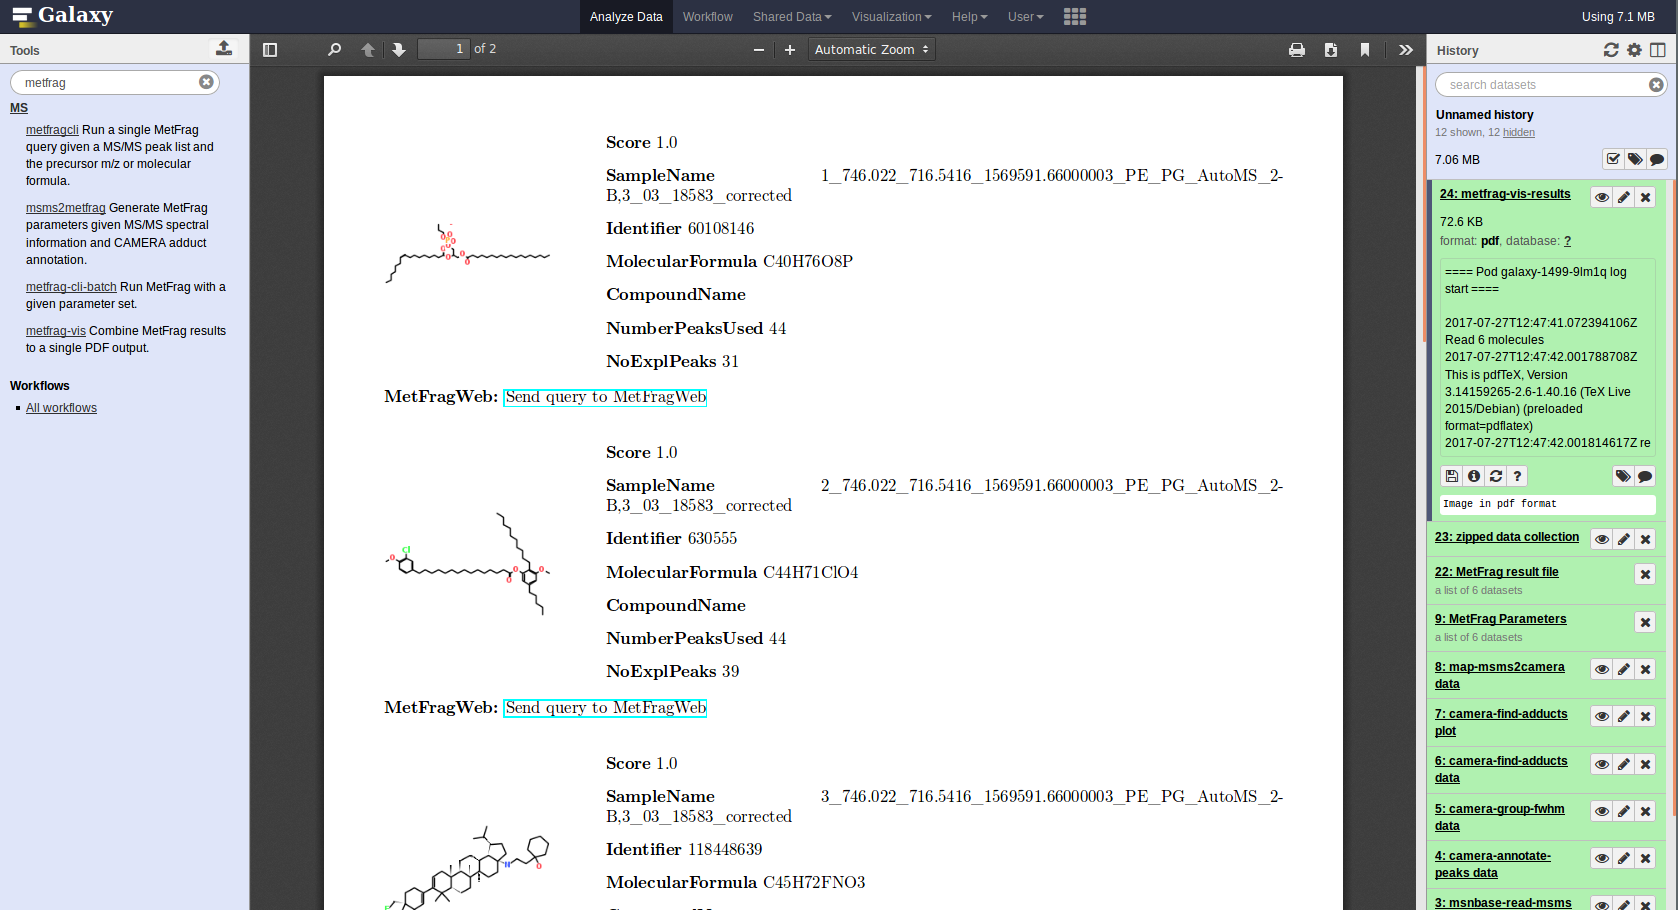
The default workflow, as presented here, packs all generated CSV files into a ZIP archive to be ready for download. The module metfrag-vis performs a visualization as it generates a result summary displaying the top candidate hits for each MS/MS peak list processed by MetFrag. It uses the generated MetFrag parameter and result files to create a PDF file that can be directly displayed in the Galaxy browser.

The PDF includes URLs for each entry pointing to the MetFragWeb tool which enables to re-run interesting queries for further analysation.
The MetFrag workflow will be enhanced by the usage of file databases that can be uploaded as CSV files to Galaxy. This feature is already available in the developmental release. Furthermore, new modules will be added to perform additional post-processing steps. This includes the generation of Metabolite Annotation Files (MAF) as part of the ISA-Tab format, which also enables the opportunity to perform further statistical analysis.
The processing of multiple mzML files originating from several samples will also be part of the workflow in one of the future releases. Although, the modules are already included in the current PhenoMeNal to enable the workflow to process multiple mzML files, we decided to keep it as simple as possible. However, more complex MS/MS workflows will be made available in the next releases. This also includes the integration of OpenMS and teaming it with XCMS and CAMERA to be more flexible in the functionality and usage of different tools available.
For a step-by-step video tutorial of the work flow see webinar on LC/MS data analysis with XCMS and MetFrag on PhenoMeNal
 |
Funded by the EC Horizon 2020 programme, grant agreement number 654241 |  |
|---|
